Nobody plays five games
Last week, we had a few teams playing just five games, in addition to an eight-game week for the Tigers. However, with everyone playing on Memorial Day Monday, no team has two days off this week. This should give us more options for two-start pitchers – check out Scott White's look at the best when you're finished here – and should also make your lineup decisions a bit easier. Start your stud and ride the hot hand if you want because you don't have to worry about any of your best options having fewer opportunities to contribute.
6 games: ATL, CHC, CHW, CIN, DET, HOU, KC, PHI, PIT, SD, SF, TB, TEX, WAS
7 games: ARI, BAL, BOS, CLE, COL, LAA, LAD, MIA, MIL, MIN, NYM, NYY, OAK, SEA, STL, TOR
Where have all the lefties gone?
So, yes, there are still things to keep in mind with the schedule, one that Scott White pointed out: eight different teams aren't set to face a single left-handed pitchers this week. Here they are (these could obviously change over the weekend with scratches or rotation changes):
Braves
Cubs
Reds
Dodgers
Twins
Mets
Athletics
Rangers
Among these rosters, you might consider sitting someone like Jay Bruce or Nomar Mazara if they were set to face a few lefties, but you can start them safely this week. On the other end of the spectrum, you've got guys like Mike Napoli, Adam Duvall and Ryon Healy, who have struggled against right-handed pitching and who you might at least consider sitting.
How will David Price look?
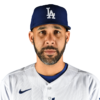

How should we handle the return of David Price? I can't imagine waiting nearly two months for him to return, only to sit him during a two-start week immediately upon his return, but maybe you should consider it.
I want to believe Price will be fine in the long term, but it's no sure thing. Even "minor" elbow injuries tend to not be, and the early results aren't super promising. Rehab starts are like spring training, in that you don't want to put too much weight on their results, but it still doesn't seem great that Price was tagged for six earned runs on 12 hits in 5 2/3 innings in his two rehab starts. It could have just been the result of him not worrying about results, or perhaps just some typically iffy minor-league defense behind him, but if you have concerns about how Price will return from his injury, this wasn't a good tuneup.
Even if Price ends up fine in the long run this season, he might need time to shake off the rust. He hasn't pitched since last October, and has to land in two tough parks in Week 9, starting on the road against the White Sox and Orioles. In all likelihood, you're going to start Price, and you probably should. But, it feels like a bit less of a sure thing than you might think at first glance.
What's up with Sonny Gray's slider?


Generally speaking, you need at least one great breaking ball to get strikeouts. Sonny Gray has never been a great strikeout pitcher, but he's always had a great slider, with a career 20.8 percent swinging strike rate with the pitch for his career. However, he has typically used it much less often than his curveball, even with two strikes. That curveball often generates the kind of weak contact Gray has thrived on at his best, so it's hard to blame the strategy even though it limits his strikeout potential.
We could be seeing a change here. Not in the quality of Gray's pitches, necessarily, but in his usage. Gray barely used his slider in his first three starts of the season, opting instead to throw his curveball around a quarter of the time. That has changed in recent starts, as he has thrown 43 combined sliders over his last two, compared to just 25 curveballs, per BrooksBaseball.com. That helps explain the combined 19 strikeouts over 13 innings of work, not to mention the 31 swinging strikes.
The question now is whether he keeps this trend up, or if it was just a response to specific circumstances and won't keep up moving forward. This week will be a good test, with the Indians and Nationals on the schedule, two strong offenses with lefty bats who might not be as susceptible to the slider. Gray isn't a must-start pitcher in Week 9, but it's hard to go away from him at this point. If he succeeds this week, I can't imagine you'll find reason to sit him again this season.
Power outliers
If you only define power by home runs, you're going to make plenty of mistakes. Homers are important obviously – doubles and triples don't even matter in Roto – but they are also relatively rare events that are hard to predict on an individual basis. Catch a gust of wind at the right time, and a lazy fly ball out might land in the second row of seats, and that counts the same as a 480-foot bomb into the upper deck.
Right now, we have six hitters on pace for 50 homers and 31 on pace for 40-plus, but I'm going to guess those numbers won't hold up. One way to predict whether someone's current power production will sustain is by comparing their hard-hit rate to their home-run-to-flyball ratio. Hitting home runs requires a hitter to do two things, generally speaking: Hit the ball in the air, and hit the ball hard. So, let's look at who has benefited from a bit of good luck, seeing more balls fly over the fence than their hard-hit rate might suggest.
This isn't worth a full story on its own, but since I've been using this weekly column as a place to dump interesting stats that don't fit in anywhere else, here are some of the early season power standouts most likely to see regression coming moving forward.
Mark Reynolds: 30.8 HR/FB%, 35.8 hard-hit%
We've already seen the regression come for Reynolds, who is homerless in 58 plate appearances since his four-homers-in-four-games stretch. Reynolds' .629 OPS in that span isn't the new normal, but he's probably going to be the same guy he was last year, when he posted an .806 OPS in 441 plate appearances, and really wasn't on mixed-league radars.
Aaron Judge: 42.9 HR/FB%, 45.9 hard-hit%
A 45.9 percent hard-hit rate is still an absurd rate, one that would have matched David Ortiz for the best mark in baseball a year ago. Of course, Ortiz's HR/FB ratio was around 19 percent, not 43. It's possible to buy into Judge's prodigious power and still think there's plenty of room for regression. One key reason to think so: No player has hit more than 31.8 percent of their flyballs out of the yard over the last decade. We're already starting to see Judge's strikeout rate regress, and with half as many homers in May as in April in only four fewer plate appearances to date, we're already seeing the power regress. That isn't to say Judge won't be good, just that he can't be this good moving forward.
Bryce Harper: 29.2 HR/FB%, 33.9 hard-hit%
It is interesting to note that, while Harper looks like the 2015 version of himself in results, his batted-ball profile looks a bit more like last season, when he had a 34.1 percent hard-hit rate. This is one situation where I would trust Harper's current level of production because I trust the talent more than I necessarily buy the numbers.
George Springer: 25.0 HR/FB%, 33.9 hard-hit%
Because he is a right-handed, pull-heavy hitter playing half his games in Houston, Springer has always produced more homers than his batted-ball profile may suggest, but he's still more likely to fall to the 18-20 percent range he has been in during past seasons. As long as he continues to hit two balls in the air for every one on the ground, Springer's ceiling for homers is probably still around 30, with 25 perhaps a more reasonable expectation.
Travis Shaw: 26.5 HR/FB%, 36.8 hard-hit%
Shaw was one of Heath's favorite breakouts coming into the season, largely because he hits a lot of flyballs and plays in a favorable offensive environment for power. He has lived up to those hopes with nine homers, but his paltry 27.2 percent flyball rate has badly regressed. A 36.8 percent hard-hit rate is actually really good, but it's not enough to sustain balls leaving the yard over a quarter of the time, even in Miller Park.