More MLB: Scoreboard | Standings | Probable Pitchers | Sortable Stats | Odds
For a good two years now, Justin Verlander has been the best pitcher in the world. He won the AL Cy Young and MVP awards in 2011, becoming the first pitch to do so since Roger Clemens in 1986. The FanGraphs version of WAR says he was even better in 2012 (7.0) than 2011 (6.8) despite the lack of hardware.
This season has gone differently for the 30-year-old. The Orioles tagged Verlander for five runs on seven hits and four walks in five innings on Tuesday night, giving him a 3.72 ERA and 1.35 WHIP in 15 starts this season. The last time he had an ERA and a WHIP that high was 2008, when he lead the league in losses and had (by far) the worst year of his career. A 112 ERA+ is still pretty good, but it's obvious he has not lived up to his lofty standards in 2013.
The most interesting part of Verlander's "down" season is that he really isn't pitching all that differently than he had the last few years, at least in terms of the underlying performance. Here's what he did the previous two years, when he really took hold of that "Best Pitcher in the World" crown, compared to this year:
| 2011-12 Verlander vs. 2013 Verlander | ||||||||
| Year | K% | BB% | GB% | FB% | LD% | HR/FB% | BABIP | FIP |
| 2013 | 27.0 | 8.1 | 42.1 | 33.5 | 24.4 | 8.2 | .344 | 2.82 |
| 2011-12 | 25.4 | 6.1 | 41.3 | 38.9 | 19.9 | 8.6 | .255 | 2.97 |
The difference in walk rate is two walks for every 100 batters faced, which is basically two walks for every three starts or so. Not a huge difference. Otherwise his strikeout and ground ball rates are damn near identical (actually better in 2013, really), and the fly balls aren't leaving the yard any more frequently than they had in the past. The FIPs line right up with each other.
There are two elephants in the room here that tie together. The first is Verlander's batting average against on balls in play, which has jumped nearly 90 points (!) in 2013. The general BABIP explanation says hitters have their own individual BABIPs while pitchers tend to sit near one common league average. That is not entirely true, however. Pitchers do have some control of their BABIP, albeit less than hitters. Fly balls are turned into outs more easily than ground balls, which is why fly ball pitchers tend to have lower BABIPs, for example.
The second is Verlander's line drive rate, which jumped more than five percent this year. It's very important to note that batted ball data is subject to scorer bias; grounders, fly balls and line drives are recorded by a person watching the game and logging what they see, not some highly sophisticated and standardized system like PitchFX. One scorer's line drive is another's fly ball, which is why the five percent change in line drive rate -- which comes entirely at the expense of the fly ball rate -- can't be taken as gospel.
Now, that potential for scorer bias doesn't mean Verlander is not allowing harder contact this year. He has always been a unique case because he's so overpowering and generates a lot of weak contact, particularly on the infield -- 11.3 percent of his career fly balls have been infield pop-ups, including 12.9 percent from 2011-12 and 14.1 percent in 2013. Infield pop-ups are (by far) the easiest batted ball to turn into an out, which partially explains why Verlander has enjoyed a lower than usual BABIP in recent years. On the other side of the coin, more line drives (like this year) would mean more hits allowed and a higher BABIP.
While the strikeout, ground ball, infield pop-up and all those other rates have remained relatively the same this year, Verlander is not throwing as hard this season as he has in the past. There's no scorer bias there; the PitchFX system is rather precise when it comes to velocity, and the Tigers' ace is down a tick in 2013. Here's a graph from the indispensable Brooks Baseball:
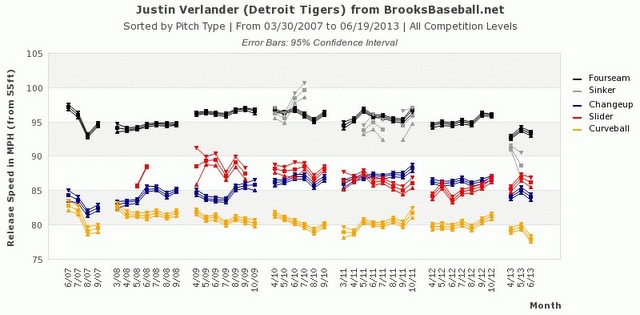
Sorry about the clutter, but the most important thing in the graph are the black lines at the top. That is Verlander's fastball over the years, which you can see has gone from sitting at or above 95 mph from 2009-12 to something less than that in 2013. In fact, his average fastball velocity has declined for four straight years now, topping out at 95.6 mph in 2009 to bottoming out at 93.5 mph in 2013.
Of course, a 93+ mph fastball is still way better than league average and more than enough to get by even though it is down for the freakish Verlander. Without knowing for sure, I'm guessing age and throwing 200+ innings year after year for the better part of a decade are starting to take their toll. It happens to everyone, even all-time greats.
The interesting thing about Verlander's reduced velocity is that he may be compensating by using his fastball less and relying more on offspeed pitches. Here are his pitch usage percentages per PitchFX over the last few years (last chart/graph, I promise):
| 2011-12 Verlander vs. 2013 Verlander | ||||||
| Year | Four-Seamer FB | Two-Seam FB | Changeup | Slider | Curveball | |
| 2013 | 38.6% | 0.6% | 35.2% | 12.8% | 12.8% | |
| 2011-12 | 45.4% | 6.9% | 20.3% | 10.3% | 17.0% | |
We're talking about a guy who went from 52.3 percent fastballs and 47.6 percent offspeed pitches from 2011-12 to 39.2 percent fastballs and 60.8 percent offspeed pitches in 2013. That's a huge difference. It's not a one or two pitches per start difference. Verlander has changed his approach drastically this season -- especially his reliance on the changeup, just look at that increase -- perhaps in response to the slightly slower fastball.
Does the reduced velocity and change in approach explain the sudden BABIP (and ERA) spike? It could, especially if hitters are having an easier time picking up the ball and reacting to his pitches, thus resulting in more and better contact. That would be very difficult to prove though. More than likely, the BABIP spike is the result of a combination of things. The Tigers have a very shaky defense, particularly on the infield where most of Verlander's weakly struck balls wind up. That's important to consider. It could also be plain ol' bad luck. His career-high 7.5 percent infield hit rate backs up the poor defense and bad luck explanations to a certain degree.
The peripheral stats like strikeout rate and ground ball rate indicate Verlander is pitching just as well this year as the last few. He has been victimized by a much higher than usual BABIP, regardless of why it has happened. His fastball is down a tick, and for whatever reason, he's changed up his pitching approach and gone offspeed heavy in 2013. Any time a power pitcher does that, it's a tiny little red flag even if the results remains very good. Verlander has been a different pitcher this year than he has been in the past, either out of necessity due to the reduced velocity or something else entirely.