More MLB: Power Rankings | Expert Picks | Latest news & notes | Fantasy news
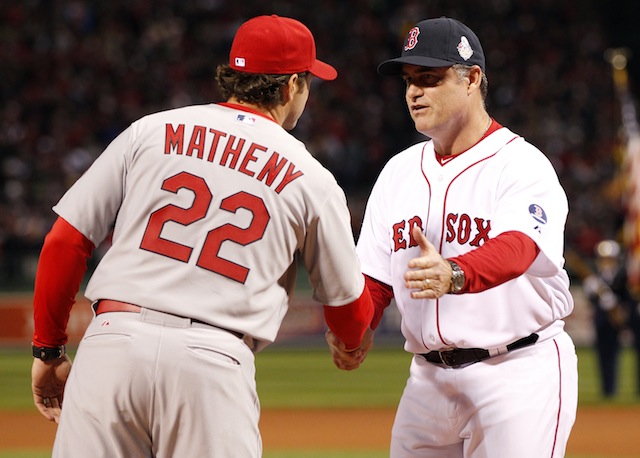
We're in June and more than one-third of the way through the 2014 season. At this juncture, the Red Sox and Cardinals -- reigning pennant winners, both -- are a combined one game under .500.
Monday's losses (CLE 3, BOS 2; KC 6, STL 0) dropped the Red Sox to 27-30 and the Cardinals to 30-28. So it's not a matter of one team bottoming out and dragging down the aggregate mark. That is, each 2013 World Series combatant has been roundly mediocre thus far. Tidily enough, their combined run differential comes out to ... zero.
This raises the matter of what's gone wrong in Boston and St. Louis. The culprit really isn't on the pitching-and-defense side of things, as the Cardinals rank fourth in the NL in runs allowed, while the Red Sox rank fifth in the AL. Rather, it's the offense: The Cards and Red Sox each rank ninth in their league in runs scored and 10th in OPS. Symmetry!
To get a bit more granular, the problem isn't keeping the line moving, as the Red Sox rank third in the AL in OBP and the Cards fifth in the NL. It's power, really. Indeed, these two teams have suffered broad-based and significant decline when it comes to hitting the ball for extra bases -- a core skill of last year's models.
To get a better idea of these struggles, let's take a look at some key power indicators and compare the 2013 World Series-bound numbers for both teams to what's going on this season.
Below you'll find the following measures: HR/G, which is simply each team's home runs per games played; SLG, which is slugging percentage; ISO, which is Isolated Power -- a gauge of raw power; and HR/FB, which is the percentage of each team's fly balls that go for home runs. Beside each number will be the team's rank in its respective league.
To the numbers ...
| Red Sox and Cardinals, power indicators 2013-14 | ||||||
| Team, year | HR/G | SLG | ISO | HR/FB | ||
| Red Sox, 2013 | 0.91 (5) | .446 (1) | .169 (2) | 11.4% (6) | ||
| Red Sox, 2014 | 0.75 (13) | .377 (11) | .130 (11) | 7.8% (13) | ||
| Cardinals, 2013 | 0.77 (13) | .401 (3) | .133 (11) | 8.9% (12) | ||
| Cardinals, 2014 | 0.52 (15) | .364 (12) | .111 (15) | 6.6% (15) | ||
| Data courtesy of FanGraphs | ||||||
As you can see, our two World Series teams have gotten worse in every regard, damnably so when it comes to SLG.
For the Red Sox, part of the problem may be a teamwide knack for making contact on the wrong pitches. The 2014 Sox rank fourth in the AL in contact rate on pitches outside the strike zone but just 14th on pitches inside the strike zone. Considering that strikes are made for hittin' and balls aren't, the Red Sox would do well to swap out those league rankings. Poor production from center field and (probably) age-related steps back for David Ortiz and Dustin Pedroia surely have a little something to do with it.
The Cardinals, meantime, aren't hitting balls in the air with much authority. The numbers above told you that to an extent, but there's also this: The Cardinals' OPS on line drives is 100 points lower than the NL average, and their OPS on fly balls is 106 points lower than the NL average.
As for their hitting with runners in scoring position, the lofty numbers from last season were bound to regress, and so they have. The Cards were actually "running a deficit" with RISP for a while this season, but those numbers are starting to fall in line with their overall levels of production, which, as noted, aren't good. The RISP stuff is noise, just as it was last season.
So while the Red Sox and Cardinals had pennants in common last season, they have a lackluster record and an inability to hit the ball hard in common this time around. There's time for all that to change, of course, and these remain two talented rosters. Right now, though, disappointment abounds in Boston and St. Louis, especially when it comes to the hometown bats.