The trade deadline has passed -- there was more activity than I expected, I am pleasantly surprised -- and we are now in the stretch run of the 2020 MLB season. The next three-and-a-half weeks will decide postseason races as well as the awards races in this unusual season. It's been a weird one. A fun one, but definitely a weird one.
Last week we examined Kyle Lewis' improving strikeout rate, among other things. Now here are three other MLB trends to keep an eye on.
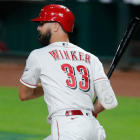
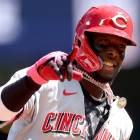
Winker taking to the DH spot

It only feels like Reds outfielder Jesse Winker has been around forever. In reality, this is the 27-year-old's fourth MLB season, but the previous three were interrupted by injuries. Winker had a hip issue in 2017, shoulder trouble in 2018, and a neck problem in 2019. This year, he's healthy, and he is mashing.
Here is the adjusted-OPS leaderboard (adjusted for ballpark, etc.):
- Nelson Cruz, Twins: 197 OPS+
- Jesse Winker, Reds: 187 OPS+
- Paul Goldschmidt, Cardinals: 185 OPS+
- Luke Voit, Yankees: 185 OPS+
- Fernando Tatis Jr., Padres: 184 OPS+
Winker is a poor defender -- he's racked up minus-3.5 WAR on defense in only 207 career games in the outfield -- so the universal DH has been a blessing for him and the Reds. It gets him in the lineup every day and the Reds don't have to worry about him giving value back in the field. His best position is the batter's box and Winker has played 24 of his 35 games at DH this year.
The underlying numbers support the surface stats. Winker is among the MLB leaders in various measures of contact quality:
- Average exit velocity: 93.4 mph (top 6 percent of MLB)
- Hard-hit rate: 55.0 percent (top 14 percent)
- Expected batting average: .311 (top 7 percent)
- Expected slugging percentage: .637 (top 4 percent)
- Barrel rate: 16.7 percent (top 9 percent)
Statcast defines a "barrel" as a batted ball "whose comparable hit types (in terms of exit velocity and launch angle) have led to a minimum .500 batting average and 1.500 slugging percentage," so it's basically the best possible contact. Furthermore, Statcast calculates expected batting average and slugging percentage using exit velocity and launch angle. Winker rates very well there.
Winker is a former first-round pick who Baseball America once said "was the best hitter in every lineup he appeared until he played with Joey Votto." His offensive potential has always been obvious, though it wasn't until this season that he started to fully put things together. Good health is a part of that. So is getting out of the field and focusing only on offense as the DH.
"He's really, really coming into his own right now," Reds ace Sonny Gray told reporters, including Bobby Nightengale of the Cincinnati Enquirer, when asked about Winker's breakout season earlier this year. "You can tell he's starting to kind of figure out what makes him go in a good way. It's really fun to watch."
Karinchak's absurd strikeout rate


Minor-league reliever stats can be deceptive. Every year there are countless relievers who post sub-2.00 ERAs with huge strikeout totals in the minors, but do it with smoke and mirrors against inferior competition. Sometimes they get called up to the big leagues and many times they get exposed. The numbers say they deserve a look, but success doesn't always follow.
No reliever in recent history had minor league numbers as eye-popping as Cleveland right-hander James Karinchak. The 2017 ninth-round pick was untouchable in the minors from 2018-19, throwing 79 innings with a 1.82 ERA and 155 strikeouts. Yes, 155 strikeouts in 79 innings, or 17.7 K/9. Karinchak struck out a whopping 47.2 percent of batters faced those two seasons. Last year it was a 59.2% -- 59.2%! -- strikeout rate in the minors.
Cleveland gave Karinchak a look as a September call-up last season and he impressed, striking out eight in 5 1/3 innings. He made the Opening Day roster this year and has quickly emerged as manager Terry Francona's go-to high-leverage reliever. In 19 innings Karinchak has allowed four earned runs runs and struck out 35.
Karinchak racks up all those strikeouts with two pitches he throws almost equally: a mid-90s fastball that features a big spin rate, and a hammer low-80s curveball that doesn't fall off the table, it drops off the roof given his over-the-top arm angle:
Nothing about it looks natural but my goodness does it work. Karinchak has struck out 35 of 70 batters faced this year, or exactly 50 percent. The highest strikeout rate in history among pitchers with at least 20 innings in a season belongs to Aroldis Chapman, who fanned 52.5 percent in 2014. Only one other pitcher finished over 50 percent (Craig Kimbrel at 50.2 percent in 2012.)
Karinchak has a chance to do it this season. It's too bad this is a 60-game season and we won't see how long he can continue at this pace, but that's not Karinchak's fault. He can only play the schedule the league gives him. Either way, Cleveland's pitching has been historically great, and Karinchak is a big part of that. He's protecting the leads the starters hand over to the bullpen.
"You see the stuff, particularly the curveball. He seems to have such a great feel for throwing it with power for a strike. Then with the ability to bounce it in every count," pitching coach Carl Willis told Cleveland.com's Paul Hoynes. "Honestly, you see him freeze a lot of guys with that curveball because of the depth that he gets and lateness of when that action takes place. He's a guy whose velocity almost gets lost in the equation. This year he's been around 94 or 95, but we know there's more than that there."
Impact of the three-batter minimum rule
This is Year 1 of the three-batter minimum rule and, as expected, the number of one- or two-batter relief appearances is down considerably. There have been 203 relief appearances of no more than two batters this season, or 0.39 per game. From 2016-19, it was roughly 0.90 such appearances per game. They'e been more than cut in half, as MLB intended.
The three-batter minimum rule stipulates pitchers must face at least three batters unless they finish the inning, at which point they can be removed. Come in with two outs and get that third out? The pitcher can be removed. He doesn't have to start the next inning and face two more batters. That's how managers are getting these one- or two-batter appearances this year.
Not surprisingly, the three-batter minimum rule has led to hitters having the platoon advantage more often, because relievers must stay in to face three batters and it's easier to pinch-hit and things like that. It's not lefty relievers who are feeling the squeeze though. It's righties who are at a disadvantage more often.
Here are the percentages of batters faced by relievers that have gone to each possible platoon scenario:
| Year | RHP vs. RHB | RHP vs. LHB | LHP vs. RHB | LHP vs. LHB |
|---|---|---|---|---|
2017 | 43.6% | 31.6% | 14.9% | 9.9% |
2018 | 42.8% | 31.6% | 15.6% | 10.0% |
2019 | 43.0% | 31.4% | 15.8% | 9.8% |
2020 | 41.4% | 33.3% | 15.5% | 9.8% |
Lefty relievers are still facing about 25 percent of all hitters, which lines up with the 75/25 righty/lefty pitcher split throughout baseball history. This year though, righty relievers have had the platoon advantage in only 55 percent of their matchups. In previous years it was just over 60 percent. I know five percentage points doesn't sound like much, but on a league-wide basis, it's enormous.
The three-batter minimum rule did not eliminate any strategy. It just changed it. Managers have to weigh the platoon advantage differently and yeah, sometimes relievers get caught up in a situation that is a poor match for their skill set. It's a new challenge, and the numbers show the rule is having an impact on matchups. They're much more difficult to get now.