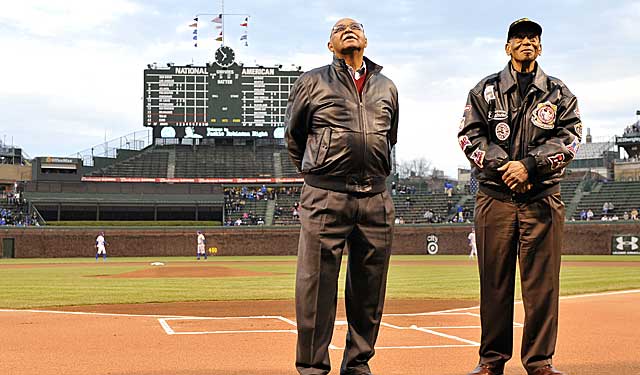
More Wrigley Field: Happy 100th Birthday | Lesser known facts
One hundred years ago today, the first ever game at Wrigley Field was played. It was called Weegham Park at the time, but while the name has changed (it was Cubs Park from 1920-26), the building has remained mostly the same.
Countless Hall of Famers and other great players have played in Wrigley Field, so let's look at the various statistical leaders in the ballpark's history. With a huge assist from the Baseball-Reference Play Index, here are the all-time Wrigley Field leaders.
| All-time Wrigley Field leaders | |
| Games Played | |
| Player | Games |
| 1. Ernie Banks | 1,285 |
| 2. Billy Williams | 1,116 |
| 3. Ryne Sandberg | 1,091 |
| 4. Ron Santo | 1,084 |
| 5. Stan Hack | 995 |
| Batting Average | |
| Player | AVG |
| 1. Paul Waner | .358 |
| 2. Rogers Hornsby | .352 |
| 3. Bill Terry | .350 |
| T-4. Riggs Stephenson | .342 |
| T-4. Willie Mays | .342 |
| On-base Percentage (min. 500 plate appearances) | |
| Player | OBP |
| 1. Rogers Hornsby | .440 |
| 2. Paul Waner | .430 |
| 3. Hack Wilson | .424 |
| T-4. Riggs Stephenson | .418 |
| T-4. Ray Grimes | .418 |
| Slugging Percentage (min. 500 plate appearances) | |
| Player | SLUG |
| 1. Willie Mays | .664 |
| 2. Mike Schmidt | .653 |
| 3. Hank Aaron | .612 |
| 4. Dave Kingman | .608 |
| 5. Hack Wilson | .600 |
| Hits | |
| Player | Hits |
| 1. Ernie Banks | 1,372 |
| 2. Billy Williams | 1,314 |
| 3. Ryne Sandberg | 1,259 |
| 4. Mark Grace | 1,175 |
| 5. Ron Santo | 1,165 |
| Doubles | |
| Player | Doubles |
| 1. Mark Grace | 242 |
| 2. Gabby Hartnett | 219 |
| 3. Ernie Banks | 218 |
| 4. Ryne Sandberg | 217 |
| 5. Billy Williams | 202 |
| Triples | |
| Player | Triples |
| 1. Ryne Sandberg | 48 |
| 2. Stan Hack | 46 |
| 3. Phil Cavarretta | 44 |
| T-4. Ernie Banks | 42 |
| T-4. Billy Williams | 42 |
| Home Runs | |
| Player | Home Runs |
| 1. Sammy Sosa | 293 |
| 2. Ernie Banks | 290 |
| 3. Billy Williams | 231 |
| 4. Ron Santo | 212 |
| 5. Ryne Sandberg | 164 |
| Runs Batted In | |
| Player | RBI |
| 1. Ernie Banks | 909 |
| 2. Sammy Sosa | 740 |
| 3. Billy Williams | 733 |
| 4. Ron Santo | 722 |
| 5. Gabby Hartnett | 615 |
| Stolen Bases | |
| Player | Steals |
| 1. Ryne Sandberg | 171 |
| 2. Kiki Cuyler | 99 |
| 3. Shawon Dunston | 96 |
| T-4. Sammy Sosa | 85 |
| T-4. Stan Hack | 85 |
| T-4. Max Flack | 85 |
| Games Pitched | |
| Player | Games |
| 1. Charlie Root | 302 |
| 2. Carlos Marmol | 258 |
| 3. Lee Smith | 256 |
| 4. Guy Bush | 233 |
| 5. Don Elston | 230 |
| Innings Pitched | |
| Player | Innings |
| 1. Charlie Root | 1,676 |
| 2. Fergie Jenkins | 1,415 2/3 |
| 3. Rick Reuschel | 1,220 1/3 |
| 4. Guy Bush | 1,219 1/3 |
| 5. Bill Lee | 1,216 1/3 |
| Wins | |
| Player | Wins |
| 1. Charlie Root | 115 |
| 2. Fergie Jenkins | 95 |
| 3. Guy Bush | 94 |
| 4. Pete Alexander | 84 |
| 5. Bill Lee | 80 |
| Losses | |
| Player | Losses |
| 1. Charlie Root | 70 |
| 2. Bob Rush | 69 |
| 3. Fergie Jenkins | 62 |
| T-4. Bill Lee | 57 |
| T-4. Rick Reuschel | 57 |
| Saves | |
| Player | Saves |
| 1. Lee Smith | 98 |
| 2. Bruce Sutter | 69 |
| T-3. Carlos Marmol | 57 |
| T-3. Randy Myers | 57 |
| 4. Rod Beck | 43 |
| Strikeouts | |
| Player | Strikeouts |
| 1. Fergie Jenkins | 1,070 |
| 2. Charlie Root | 812 |
| 3. Carlos Zambrano | 774 |
| 4. Kerry Wood | 753 |
| 5. Rick Reuschel | 722 |
| Earned Run Average (min. 400 Innings Pitched) | |
| Player | ERA |
| 1. Hippo Vaughn | 2.18 |
| 2. Lon Warneke | 2.55 |
| 3. Pete Alexander | 2.61 |
| 4. Claude Hendrix | 2.67 |
| 5. Claude Passeau | 2.75 |
| WHIP (min. 400 Innings Pitched) | |
| Player | WHIP |
| 1. Pete Alexander | 1.098 |
| 2. Warren Hacker | 1.100 |
| 3. Jon Lieber | 1.130 |
| 4. Lon Warneke | 1.143 |
| 5. Fergie Jenkins | 1.146 |