Earlier Thursday, Chris Cwik took a look at the claim that we are seeing an unexpected spike in power through the season's first few weeks. Cwik found that, while there may have been a mini-spike of a day or two, home run production is actually down compared to past seasons.
His survey compared production during the current month to season-long trends over the last 25 years, which showed that home runs are actually occurring at a slower pace than any season since the last years of the Bush Administration -- the first one.
Of course, skeptics could look at those numbers as incomplete, citing the oft-invoked truism that power tends to build as the season goes on and the temperatures warm. So, I decided to take a look at just the April numbers over the last 10 seasons, to see if there was any significant difference between homer totals for seasons vs. just the first month of action.
| Year | HR/G | HR/G (April) | DIFF |
|---|---|---|---|
| 2014 | ??? | 0.84 | ??? |
| 2013 | 0.95 | 1.02 | -0.07 |
| 2012 | 1.01 | 0.94 | 0.07 |
| 2011 | 0.93 | 0.91 | 0.02 |
| 2010 | 0.94 | 0.94 | 0.00 |
| 2009 | 1.03 | 1.05 | -0.02 |
| 2008 | 1.00 | 0.89 | 0.11 |
| 2007 | 1.01 | 0.98 | 0.03 |
| 2006 | 1.10 | 1.15 | -0.05 |
| 2005 | 1.03 | 0.95 | 0.08 |
| 2004 | 1.12 | 1.09 | 0.03 |
As the chart shows, home run totals do tend to rise after April, though it isn't a particularly consistent or meaningful trend. Though home run numbers increased by 0.02 per game from April on over the course of the 10 years, they remained stagnant or actually decreased in four separate years.
Only once in the 10-year sample did we see more than a 10 percent increase in home run production over the course of a season as compared to April. Most of the time we are looking at a difference of one home run every 20 or more games played. In other words, April tends to be a harbinger of the season to come.
Sometimes conventional wisdom is backed up by the numbers, but this doesn't seem to be a case of that. In fact, the most important takeaway from this exercise might be that, on the whole, April's trends to give us a pretty good baseline for what to expect for the season ahead, at least when it comes to league-wide home run totals.
If the drop in power across the league continues through the rest of the month, we could be looking at a league-wide power outage we haven't seen in 20 years. And, as Cwik noted earlier, it might make you want to look again at those all-or-nothing slugger types, like Adam Dunn and Chris Carter, with home runs potentially at a premium.
However, if the league is going to see fewer balls leave the yard, it might be a good chance to buy low on some flyball-prone pitchers. Pitcher who historically have trouble inducing groundballs, could see a boost in their production if more of their batted balls fall harmlessly into the gloves of outfielders rather than as souvenirs.
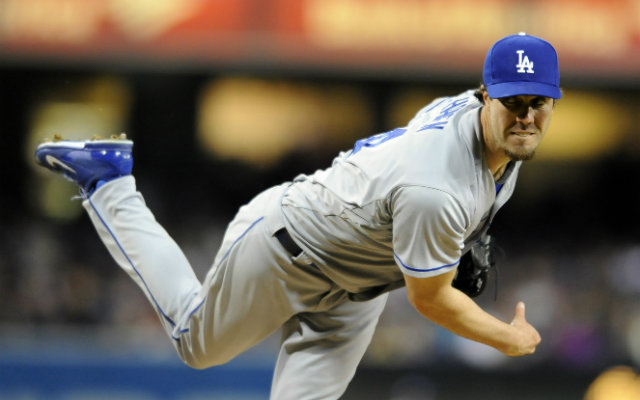
To name just one example, Dan Haren, who had the 12th highest home run per flyball rate among qualified pitchers last year could be one beneficiary. He has allowed just one longball through his first 12 innings, which is something to keep an eye on.
Winning in Fantasy sports is all about finding an edge before your league mates do, and this kind of subtle, league-wide change might be just where a savvy owner gets ahead.


