I went through the standout hitters based on Statcast data Monday, and now it's time to look at the pitchers. We've had PITCHf/x data for years, rudimentary batted-ball data for both hitters and pitchers as well, but the Statcast data allows us to pull back the layers even further.
It isn't enough to know whether a pitcher is picking up a ton of groundballs, if those groundballs are the type of screamers that are more likely to find a hole in the infield. And, though line drive rates can give us a rough idea how often a pitcher is giving up hard-hit balls, much of what was being given out before was subjective. The line between a line drive and a fly ball is a fuzzy one; your hard hit line drive into the gap could be my fly ball, after all.
However, we can now start to take some of the subjectiveness out of that. What PITCHf/x has done for our understanding of in-flight pitch mechanics, Statcast might be able to do for batted balls. Let's see what the numbers say.
This data comes from BaseballSavant.com, which has become a must-visit site for me this season. If you're interested in digging into some of the meatier data being provided by MLB for the first time this season, it should be for you as well. Their data isn't complete for various reasons, but it can at least give us a concrete starting point.
(All data filtered with minimum 200 pitches, minimum 20 balls in play tracked)
Slow down
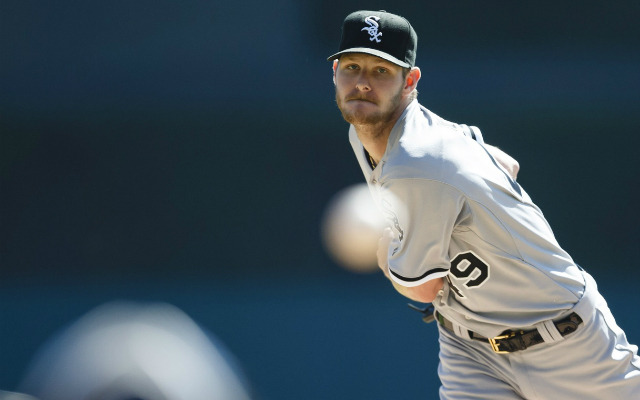
Here are the 10 pitchers giving up the lowest average batted-ball velocity: Chris Sale (81.9 MPH), Adam Wainwright (83.6), Dillon Gee (84.3), Jason Hammel (84.7), Zack Greinke (84.8), Max Scherzer (85.0), Wei-Yin Chen (85.2), Dallas Keuchel (85.3), Jake Arrieta (85.3), Gerrit Cole (85.5)
-
These 10 pitchers give up a .258 BABIP on average, compared to a league-wide average of .296 for starters. They allow an average ERA of 2.15, compared to a league-wide average of 4.03 for starters.
-
Here's a "Duh" moment: good pitchers tend not to get hit hard. Really groundbreaking stuff here.
-
Sale's K-percentage is down from 30.4 last season and 27.1 for his career to 21.6 this season, while his groundball percentage has risen from 40.7 last season to 50.9 so far. I would expect his K-rate to rise, but if he can keep this lower groundball rate while racking up such weak contact, he could put a Cy Young award trophy on his shelf.
-
Groundballs tend to go for hits more often than flyballs, so you would expect guys like Jake Arrieta and Dallas Keuchel's BABIP to rise from .236 and .167, respectively. However, with both generating such weak contact, those will mostly turn into singles, which is a good thing. Keuchel especially is taking his groundball tendencies to an extremely, having allowed just 24 non-groundballs in play among 78 chances. And Arrieta is certainly doing everything in his power to prove last year was not a fluke.
-
Gee hasn't really changed his repertoire, and he isn't throwing any harder than last season, so the jump in his groundball percentage from 44.1 to 61.0 is a bit hard to buy. It's also a bit surprising to see him rate this highly with a 15.8 HR/FB ratio, so we'll see if it is an aberration. He has consistently posted HR/FB rates above 10 percent.
Getting smoked
Let's take a look at the other side, with the 10 pitchers giving up the highest average batted-ball velocity: Vance Worley (94.1), Kyle Kendrick (93.0), Tim Lincecum (92.6), Chase Anderson (92.4), Trevor May (91.9), Ryan Vogelsong (91.9), Miguel Gonzalez (91.9), James Shields (91.8), Mat Latos (91.7), Tyler Matzek (91.7)
-
These 10 pitchers allow an average BABIP of .332, compared to a league-wide average of .296 from starters. They allow an average ERA of 4.53, compared to a league-wide average of 4.03 for starters. If you take out James Shields, the ERA balloons to 4.80
-
Clearly, this is not a list you want to be on, and James Shields' presence doesn't really do anything to change that. There will always be outliers, but the fact that Shields is thriving while giving up a lot of hard-hit balls doesn't mean this can be a road map to success for other pitchers, unless they also have an 80-grade changeup they can throw on nearly 40 percent of their pitches with a 26.5 percent whiff rate. Shields has always given up a relatively high number of extra-base hits, he just keeps runners off base and strands them at a high rate.
-
Latos' first start was an absolute disaster, with four batted balls exceeding 100 MPH. However, even removing that outing from the equation, he only drops from ninth to 19th out of 132 pitchers. He has been better over his last three starts, with 8.2 K/9 and 2.9 BB/9, however he has still given up 31 fly balls to only 15 groundballs. The fact that he is getting hit so hard consistently makes the fact that he has only allowed one home run seem borderline miraculous. Even acknowledging that, he probably has the second-most upside out of this group after Shields, but that isn't saying a whole lot, and is based almost entirely on his track record and the assumption that he can reach that level again.
Stray thoughts
-
One possibly meaningful conclusion to draw, pointed out by my coworker Heath Cummings, is the Coors Field effect. A few of these pitchers have already made starts at Coors, so it is possible that impacts these numbers. The effect the thin air in Denver has on balls is well known, as the thin air makes them travel farther and move less when thrown. So far, the average battled ball tracked at Coors Field has been hit 89.9 mile per hour, the highest in the majors. The average velocity for a batted ball has been 88.4 miles per hour overall, though it is obviously too early to say how much environmental factors might play in, though it wouldn't be a surprise if Coors ended up playing a part.
-
Back to that "'Duh' Moment" from earlier… Yes, some of the conclusions drawn here are obvious. Good pitchers are going to get hit hard less often than bad pitchers. However, a conclusion being obvious doesn't mean it goes without saying, especially when it comes about as the result of concrete data. The fact that we can say with some certainty, "Pitcher X gives up fewer hard-hit balls than Pitcher Y," has value, even if anybody who watches them can tell you Pitcher Y isn't in Pitcher X's league.
-
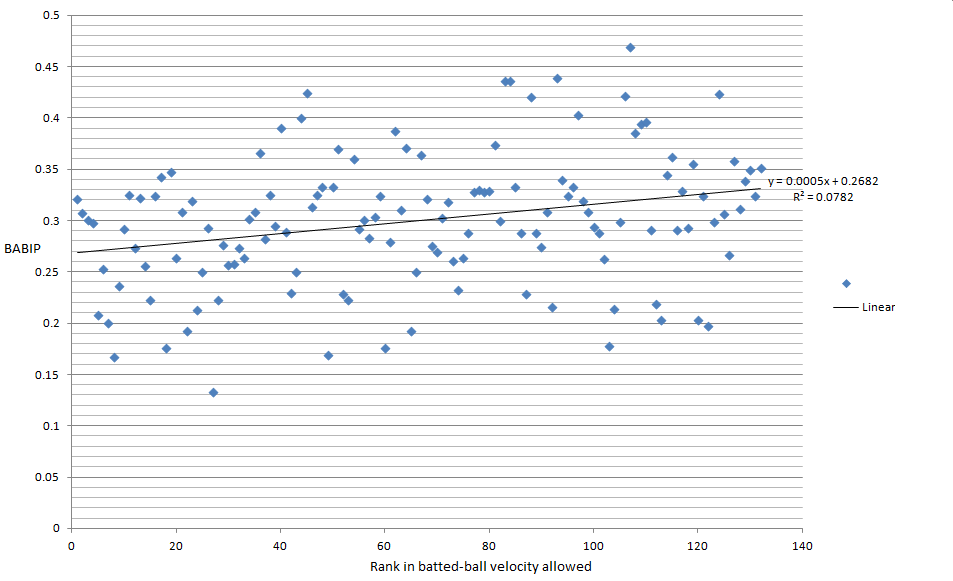
One of the outcomes I hope can come about from this data becoming more widely available is a more useful xBABIP stat. Right now, your expected BABIP formulas are based largely on the assumption that all ground balls, line drives and fly balls are created equal. If we could assign an expected hit value for batted balls based on the angle of elevation, exit velocity and hit location, we might be able to say with more certainty when someone is making outs due to bad luck, vs. bad swings.
-
By the way, here is a scatter plot showing the relationship between batted-ball velocity and BABIP this season for each pitcher: