More MLB: Scoreboard | Standings | Probable Pitchers | Sortable Stats | Odds
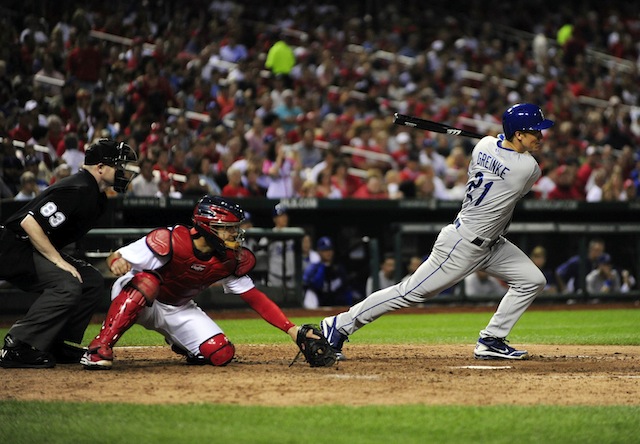
Zack Greinke of the Dodgers is having another quality season on the mound: 19 starts, 3.21 ERA, 111 ERA+, 2.82 K/BB ratio.
But here's what Greinke's doing at the plate: .385/.467/.436 with two doubles (!) and five walks (!!) -- all unintentional, of course -- in 49 plate appearances. First and foremost, this is obviously the small sample size at work. Roughly anything can happen over the course of 49 plate appearances, and Greinke's pre-2013 career slash line of .170/.191/.302, while strong, suggests he's over his head this season (to say the least).
Still, those numbers -- no matter how limited the sample and now matter how out of character -- happened, and they provided real value to the team. So let's compare what Greinke's done thus far in 2013 to the best hitting performances by pitchers across baseball history.
To do this, we'll use Baseball-Reference.com's Play Index, which is as essential to the good life as cash and oxygen, and set the bottom limit at 40 plate appearances (convenient end point, admittedly). Also, we'll confine the search to those who appeared as a pitcher in at least 90 percent of their games for the season in question. We'll sort by OPS+, which is a nifty one-shot offensive metric that's briefly explained here. Here's the Play Index screen-grab ...
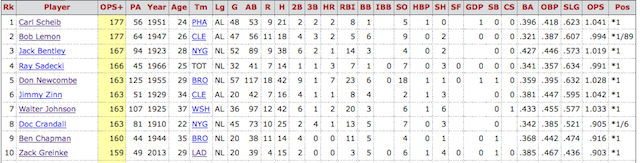
As it turns out, Greinke ranks 10th all-time, according to the criteria listed above, with an OPS+ of 159. He's behind names like Bob Lemon, a Hall of Famer and one of the best-hitting pitchers of all-time, in 1947; Don Newcombe in 1955; Walter Johnson in 1925; and Ben Chapman (1944), who was an All-Star-caliber outfielder in the 1930s before reviving his career a pitcher during the war years. If Greinke somehow manages to get a bit hotter over the final month-and-a-half of the season, then he has a realistic shot at winding up in the top five.
So how's he doing it? Broadly speaking, he's being more selective (Greinke's swinging at 45.1 percent of the pitches he sees versus a career average of 50.7 percent) and making better contact when he does swing (96.2 percent contact rate on pitches in the strike zone versus career mark of 89.6 percent). To repeat, though, the peculiarities of the small sample size are also surely at work.
Greinke's unlikely success, though, speaks to something larger going on in L.A. -- that the Dodgers' pitching staff as a group is faring quite well at the plate this season. Dodger hurlers are batting .177/.232/.234, while the average pitcher has a 2013 slash line of .132/.161/.170. That's a notable margin, and keep in mind that Dodger Stadium is a pretty tough environment for hitters.
Add it all up, and Dodger pitchers with bats in their hands have combined for a WAR of 1.3, which is more than twice the figure belonging to the Braves, the next-best-hitting staff in 2013. Much like Greinke, they command the strike zone as a unit -- Dodger pitchers as hitters have the second-lowest K% in the NL and highest BB%.
To be sure, this isn't any kind of leading reason for the Dodgers' success in 2013, but it's certainly helping the cause. And Greinke's potentially historic season at the plate is part of it.