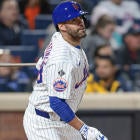
Who among us hasn't seen that TV ad with Joe Torre soaking up the L.A. lifestyle -- driving a convertible, doing yoga and surfing (with his Dodger hat still on, no less.) Now I'm waiting for the version where Casey Blake is downing shots of wheatgrass with his skipper. Blake has transformed from a fringe Fantasy third basemen to a player worthy of mixed league status at a position that is suddenly stacked. While it makes a good story to pin Blake's makeover on his new West Coast way of life, his improvement actually started during his final weeks in Cleveland. Since the beginning of July, Blake has hit .330 and slugged .589. His Chipper-like average has been driven by a huge spike in his power-hitting (though it is manifesting itself mostly as doubles), but it has also been helped by a just-plain-silly 40 percent H/BIP rate. This recent spurt of good luck has catapulted Blake onto the "Lucky Hitters" list for the first time this year. With more typical luck over the remainder of the season, his average should regress back towards the .280 mark if he continues on his doubles binge, and even lower if his power tails off.
Meanwhile back in Cleveland, Blake seems to have left a spell on his replacement, Andy Marte. Not that this was at all necessary. In his big league career, Marte has been his own worst enemy, hacking his way to a .193 average. This year, he appears to be outdoing himself, hitting only .177 and striking out 36 times in 147 at-bats. Still, even an extreme flyball hitter like Marte should be getting base hits on more than 21 percent of his balls in play. He is nowhere even close to be ready for mixed league action, but with better fortunes, he will be useful enough in AL-only leagues to be active in more than just two percent of CBSSports.com leagues.
To earn a place on the "Good Stats, Good Skills" list, a pitcher doesn't need to rack up obscene strikeout totals. Chris Volstad and Salomon Torres are achieving Fantasy success, even though neither punches out as many as 6.5 batters per nine innings. Batters put their fair share of balls in play against them, but Volstad and Torres don't pay the price, because they limit the long ball. With his low-90s sinking fastball, Volstad has given up only one homer to date, while Torres has yielded just three. As a result, Volstad has three wins in his first five major league starts, Torres has racked up 22 saves in 26 opportunities, and both have ERAs under 3.00. ERCs in the low-3.00s suggest that both pitchers may experience a slight increase in ERA, but their near-normal H/BIP rates indicate that any decline in their overall performance levels will be minimal.
While Volstad is living by the ground ball, Jon Garland is getting killed by it. Like other extreme low-strikeout pitchers, Garland has an extraordinary number of balls put into play against him. In the past, he has done well by limiting his walks and ground balls, which are more likely to become base hits than flyballs. His control isn't quite as sharp as it has been in the past, and his grounball-to-flyball ratio has increased by 44 percent over last year. Garland's ERA is a still-passable 4.28, but his ERC projects it to be much closer to 5.00. Once owners put that expected ERA increase together with his unattractive 1.44 WHIP, we should expect to see Garland disappear from some of the 74 percent of CBSSports.com leagues where he currently resides.
All statistics below are for season-to-date performances through Saturday, August 9.
| 'Lucky' Hitters | H/BIP | RC/27 | 'Lucky' Pitchers | H/BIP | ERC |
| Ian Stewart, 3B, Colorado | 45% | 8.3 | Troy Percival, RP, Tampa Bay | 17% | 2.46 |
| Jerry Hairston, OF, Cincinnati | 39% | 7.9 | Dan Giese, SP, N.Y. Yankees | 22% | 1.87 |
| Howie Kendrick, 2B, L.A. Angels | 39% | 6.0 | Justin Duchscherer, SP, Oakland | 23% | 2.19 |
| Brandon Moss, OF, Pittsburgh | 39% | 5.2 | Gavin Floyd, SP, Chicago White Sox | 24% | 3.68 |
| Mike Aviles, SS, Kansas City | 38% | 7.2 | Armando Galarraga, SP, Detroit | 24% | 3.03 |
| Kelly Shoppach, C, Cleveland | 37% | 6.4 | Kevin Gregg, RP, Florida | 25% | 2.51 |
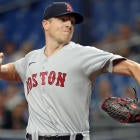
| Denard Span, OF, Minnesota | 37% | 7.2 | Daisuke Matsuzaka, SP, Boston | 25% | 3.33 |
| Edgar Gonzalez, 2B, San Diego | 35% | 4.4 | Ryan Dempster, SP, Chicago Cubs | 26% | 2.78 |
| Jesus Flores, C, Washington | 35% | 4.9 | Scott Schoeneweis, RP, N.Y. Mets | 26% | 3.99 |
| Casey Blake, 3B, L.A. Dodgers | 35% | 6.5 | John Grabow, RP, Pittsburgh | 26% | 3.82 |
| Unlucky' Hitters | H/BIP | RC/27 | 'Unlucky' Pitchers | H/BIP | ERC |
| Andy LaRoche, 3B, Pittsburgh | 18% | 2.5 | Clay Buchholz, SP, Boston | 36% | 5.69 |
| Corey Patterson, OF, Cincinnati | 19% | 2.2 | Nate Robertson, SP, Detroit | 35% | 6.01 |
| Mike Napoli, C, L.A. Angels | 21% | 5.5 | Brian Wilson, RP, San Francisco | 34% | 3.98 |
| Andy Marte, 3B, Cleveland | 21% | 2.0 | Carlos Silva, SP, Seattle | 34% | 5.44 |
| Juan Rivera, OF, L.A. Angels | 23% | 3.6 | Bronson Arroyo, SP, Cincinnati | 34% | 5.43 |
| Ben Zobrist, SS, Tampa Bay | 25% | 5.7 | Roy Oswalt, SP, Houston | 33% | 4.85 |
| Mark Ellis, 2B, Oakland | 25% | 4.0 | Aaron Harang, SP, Cincinnati | 33% | 4.67 |
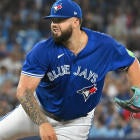
| Asdrubal Cabrera, 2B, Cleveland | 26% | 2.8 | A.J. Burnett, SP, Toronto | 33% | 4.26 |
| Austin Kearns, OF, Washington | 26% | 3.1 | Glendon Rusch, SP, Colorado | 33% | 4.81 |
| Wladimir Balentien, OF, Seattle | 26% | 2.5 | Jonathan O. Sanchez, SP, San Francisco | 33% | 4.17 |
| Good stats, good skills - hitters | H/BIP | RC/27 | Good stats, good skills - pitchers | H/BIP | ERC |
| J.D. Drew, OF, Boston | 31% | 7.9 | Ervin Santana, SP, L.A. Angels | 29% | 2.97 |
| Aubrey Huff, 1B, Baltimore | 32% | 7.5 | Chris Volstad, SP, Florida | 28% | 3.05 |
| Chris Iannetta, C, Colorado | 31% | 6.7 | Kevin Slowey, SP, Minnesota | 28% | 3.24 |
| Ty Wigginton, 3B, Houston | 30% | 6.1 | Salomon Torres, RP, Milwaukee | 28% | 3.30 |
| Shane Victorino, OF, Philadelphia | 30% | 6.0 | Mike Mussina, SP, N.Y. Yankees | 31% | 3.63 |
| Poor stats, poor skills - hitters | H/BIP | RC/27 | Poor stats, poor skills - pitchers | H/BIP | ERC |
| Jose Molina, C, N.Y. Yankees | 27% | 2.7 | Kyle Farnsworth, RP, Detroit | 30% | 5.48 |
| Freddy Sanchez, 2B, Pittsburgh | 27% | 2.9 | Tom Glavine, SP, Atlanta | 29% | 5.27 |
| Gary Matthews, OF, L.A. Angels | 28% | 3.3 | Johnny Cueto, SP, Cincinnati | 31% | 4.93 |
| Juan Uribe, SS, Chicago White Sox | 28% | 3.4 | Jon Garland, SP, L.A. Angels | 31% | 4.82 |
| Darin Erstad, OF, Houston | 34% | 4.0 | Tyler Yates, RP, Pittsburgh | 30% | 4.76 |
|
|
|
Runs Created per 27 Outs (RC/27) -- An estimate of how many
runs a lineup would produce per 27 outs if a particular player
occupied each spot in the order; ex. the RC/27 for Miguel Cabrera
would predict the productivity of a lineup where Cabrera (or his
statistical equal) batted in all nine spots; created by Bill James Component ERA (ERC) -- An estimate of a what a pitcher's ERA would be if it were based solely on actual pitching performance; created by Bill James Base Hits per Balls in Play (H/BIP) -- The percentage of balls in play (at bats minus strikeouts and home runs) that are base hits; research by Voros McCracken and others has established that this rate is largely random and has a norm of approximately 30% Isolated Power -- The difference between slugging percentage and batting average; created by Branch Rickey and Allan Roth Walk Rate -- Walks / (at bats + walks) Whiff Rate -- Strikeouts / at bats |
Al Melchior was recently a Fantasy columnist and data analyst for Baseball HQ and will be providing advice columns for CBSSports.com. Click here to send him a question. Please put "Melchior" in the subject field.