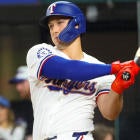
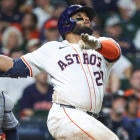
This week's "Good Stats, Good Skills" list features two pitchers who are having surprisingly good seasons. You could even say they are having magical seasons. Ervin Santana is becoming a fan favorite in L.A. with his nine wins and 3.32 ERA, and like another Magical Earvin who once played for the Lakers, he is backing up his performances with some serious skills. Santana could easily break the 200 strikeout barrier this year, and he is currently posting rates of 2.3 BB/9 and 0.8 HR/9, which would both be career bests. Better yet, his 27 percent H/BIP rate probably won't increase much, if at all, because flyball pitchers tend to have slightly lower rates than normal. While his 1.07 WHIP won't change much, Santana's 2.59 ERC points to a much lower ERA in his future.
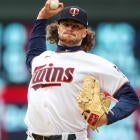
At least Santana was heralded as a young prospect; the success of "Magic" Wandy Rodriguez has been completely unexpected. He has never had great skills ratios in the majors or even in the upper minors, but now he has an outstanding K/BB ratio above 3.0 for the first time since pitching in Class-A. Despite a 7.7 K/9 rate, a 2.58 ERA and a 1.15 ERA, Rodriguez is owned in only 60 percent of CBSSports.com leagues. His 27 percent H/BIP and 2.89 ERC suggest that if he is getting lucky, it's only by a little bit. Rodriguez's underlying skill stats and steady improvement let us know that his performance is legit.
While Rodriguez's success has slid under the radar of many owners, the demise of Jason Varitek seems to be an equally well-kept secret. Despite an RC/27 well below the median level for starting catchers and a skill set that has declined appreciably over the last three years, he is still owned in 78 percent of our leagues. He has slumped badly in June, and owners may be waiting for him to rebound. A month ago, Varitek's skill numbers made it look like he was recapturing the mojo of his peak years, when he would routinely hit around .280 with 20 HR and 70 RBI. Now his Isolated Power average and whiff rate mirror what he had done last year, portending lower Fantasy numbers across the board. Earlier this season, I was buying into the Varitek Renaissance, but I should have taken his age and his recent track record into account. His current .228 average is closer to what he will produce by season's end, along with only 15 HR and 50 RBI.
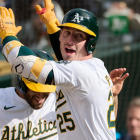
Finally, for those perusing the "Lucky Pitchers" list who are perplexed by the inclusion of A's hurlers Justin Duchscherer and Andrew Brown, here's the explanation. It's true enough that both have ERCs close to 2.00, so given the number of balls in play that are becoming base hits against them, they are allowing the expected number of earned runs. However, both are sporting H/BIP percentages in the low 20s. If those rates climb as expected, both pitchers' WHIPs will increase. As they allow more runners to reach base, we will start to see their ERAs rise as well.
Without the favorable H/BIP rate, Duchscherer could just as easily have Andy Sonnanstine's stats, or at least something much closer to them than his own. Both pitchers have K/9 rates around 6.0 and BB/9 rates near 2.0. Only two things are significantly different in their performances: Sonnanstine has given up four more homers and his H/BIP is 12 percentage points higher than Duchscherer's. The former does not account for a nearly three run difference in their ERAs, and the latter is largely a matter of chance. Having low H/BIPs doesn't mean that Duchscherer and Brown are actually bad pitchers, but it does mean that neither is very likely to finish with an ERA below 3.00, much less in the sub-2.00 territory that they currently inhabit.
All statistics below are for season-to-date performances through Saturday, June 28.
| 'Lucky' Hitters | H/BIP | RC/27 | 'Lucky' Pitchers | H/BIP | ERC |
| Edgar Gonzalez, 2B, San Diego | 38% | 4.4 | Andrew Brown, RP, Oakland | 20% | 2.08 |
| Ramon Vazquez, 3B, Texas | 38% | 7.5 | Justin Masterson, SP, Boston | 21% | 3.37 |
| Jeff Baker, 1B, Colorado | 37% | 5.8 | Gavin Floyd, SP, Chicago White Sox | 21% | 3.10 |
| Brian Buscher, 3B, Minnesota | 37% | 6.1 | Armando Galarraga, SP, Detroit | 21% | 2.88 |
| Jesus Flores, C, Washington | 37% | 5.4 | Justin Duchscherer, SP, Oakland | 23% | 1.86 |
| Fred Lewis, OF, San Francisco | 36% | 6.1 | Kevin Gregg, RP, Florida | 24% | 2.75 |
| Clint Barmes, SS, Colorado | 36% | 6.5 | John Lackey, SP, L.A. Angels | 24% | 2.23 |
| Johnny Damon, OF, N.Y. Yankees | 35% | 6.9 | Scott Olsen, SP, Florida | 25% | 3.49 |
| Adam Jones, OF, Baltimore | 35% | 4.4 | Joe Saunders, SP, L.A. Angels | 25% | 3.14 |
| Mike Aviles, SS, Kansas City | 35% | 6.8 | Brandon Lyon, RP, Arizona | 26% | 2.89 |
| Unlucky' Hitters | H/BIP | RC/27 | 'Unlucky' Pitchers | H/BIP | ERC |
| Troy Tulowitzki, SS, Colorado | 17% | 1.3 | Arthur Rhodes, RP, Seattle | 39% | 3.51 |
| Mike Napoli, C, L.A. Angels | 20% | 4.9 | Takashi Saito, RP, L.A. Dodgers | 36% | 2.85 |
| Cody Ross, OF, Florida | 20% | 4.6 | Rafael Betancourt, RP, Cleveland | 36% | 5.41 |
| Eric Byrnes, OF, Arizona | 22% | 2.9 | Andrew Miller, SP, Florida | 35% | 4.78 |
| Ronnie Belliard, 2B, Washington | 22% | 4.4 | Randy Johnson, SP, Arizona | 35% | 4.60 |
| Jonny Gomes, OF, Tampa Bay | 23% | 4.9 | Andy Sonnanstine, SP, Tampa Bay | 35% | 4.45 |
| Jose Vidro, DH, Seattle | 23% | 2.9 | Brian Wilson, RP, San Francisco | 35% | 3.77 |
| Mike Jacobs, 1B, Florida | 24% | 4.5 | Nate Robertson, SP, Detroit | 34% | 5.23 |
| Melvin Mora, 3B, Baltimore | 25% | 3.3 | Jarrod Washburn, SP, Seattle | 34% | 5.47 |
| Freddy Sanchez, 2B, Pittsburgh | 25% | 2.6 | Javier Vazquez, Chicago White Sox | 34% | 4.54 |
| Good stats, good skills - hitters | H/BIP | RC/27 | Good stats, good skills - pitchers | H/BIP | ERC |
| Kevin Youkilis, 1B, Boston | 35% | 7.6 | Jorge Campillo, RP, Atlanta | 28% | 2.22 |
| Ryan Ludwick, OF, St. Louis | 33% | 7.5 | Cliff Lee, SP, Cleveland | 30% | 2.30 |
| Marcus Thames, OF, Detroit | 25% | 7.3 | Ervin Santana, SP, L.A. Angels | 27% | 2.59 |
| Nate McLouth, OF, Pittsburgh | 29% | 7.1 | Scot Shields, RP, L.A. Angels | 30% | 2.60 |
| Luke Scott, OF, Baltimore | 30% | 6.8 | Wandy Rodriguez, SP, Houston | 27% | 2.89 |
| Poor stats, poor skills - hitters | H/BIP | RC/27 | Poor stats, poor skills - pitchers | H/BIP | ERC |
| Jason Bartlett, SS, Tampa Bay | 29% | 2.8 | Brandon Backe, SP, Houston | 30% | 6.19 |
| Alex Cintron, 3B, Baltimore | 31% | 3.4 | Brett Myers, SP, Philadelphia | 31% | 6.07 |
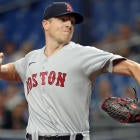
| Jason Varitek, C, Boston | 28% | 3.6 | Mark Hendrickson, SP, Florida | 31% | 5.37 |
| Jose Castillo, 3B, San Francisco | 30% | 4.0 | Todd Jones, RP, Detroit | 30% | 5.15 |
| Dmitri Young, 1B, Washington | 31% | 4.5 | Garrett Olson, SP, Baltimore | 31% | 4.76 |
|
|
|
Runs Created per 27 Outs (RC/27) -- An estimate of how many
runs a lineup would produce per 27 outs if a particular player
occupied each spot in the order; ex. the RC/27 for Miguel Cabrera
would predict the productivity of a lineup where Cabrera (or his
statistical equal) batted in all nine spots; created by Bill James Component ERA (ERC) -- An estimate of a what a pitcher's ERA would be if it were based solely on actual pitching performance; created by Bill James Base Hits per Balls in Play (H/BIP) -- The percentage of balls in play (at bats minus strikeouts and home runs) that are base hits; research by Voros McCracken and others has established that this rate is largely random and has a norm of approximately 30% Isolated Power -- The difference between slugging percentage and batting average; created by Branch Rickey and Allan Roth Walk Rate -- Walks / (at bats + walks) Whiff Rate -- Strikeouts / at bats |
Al Melchior was recently a Fantasy columnist and data analyst for Baseball HQ and will be providing advice columns for CBSSports.com. Click here to send him a question. Please put "Melchior" in the subject field.