Note: The NCAA Tournament selection committee will reveal all 68 teams before the bracket during the Selection Sunday show. To choose the teams for the announcement - and to build the bracket for the NCAA Tournament, the committee uses official "team sheets" to evaluate teams and determine how teams are seeded. CBS Sports Bracketology expert Jerry Palm explains what data is actually on these "team sheets" and what criteria is considered for each team's "tournament resume."
When it comes to breaking down seeding and selection for the NCAA Tournament, all of the arguments are based around what is on each team's "tournament resume." Every pundit seems to have a different opinion what is or what should be included.
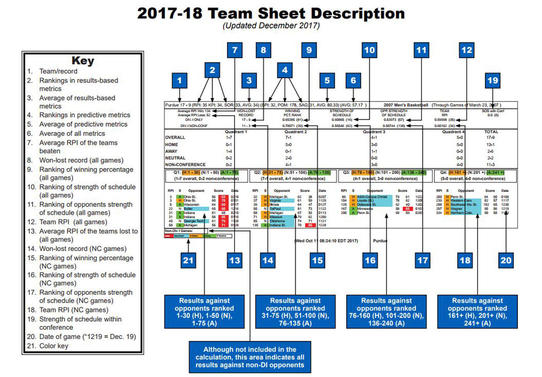
However, the only opinion that really matters on that subject is that of the NCAA selection committee. So, in the interest of settling those disputes, here is what an actual NCAA Tournament resume, or what the committee calls a "team sheet" looks like.
Click here to enlarge Team Sheet image
There are several important changes in the "team sheets" from year's past. The biggest difference in the sheet from last season to this season is the introduction of "quadrants," which is how games of varying quality are grouped. In the past, they were grouped strictly by RPI (1-50, 51-100, 101-200, 200+). Now there is a home/road/neutral element to that as the committee now breaks down each team's game in "Quadrants" or "Tiers." You can read more about that here, but essentially the new categories are:
- Quadrant 1: Games at home vs teams ranked 1-30 in the RPI, Neutral vs 1-50, Road vs 1-75
- Quadrant 2: Home vs 31-75, Neutral vs 51-100, Road vs 76-135
- Quadrant 3: Home vs 76-160, Neutral vs 101-200, Road vs 136-240
- Quadrant 4: Home vs 161+, Neutral vs 201+, Road vs 241+
The team's games are listed in four quadrants along with the overall and non-conference record for games in each quadrant. For each game, the RPI of the opponent, site (Home/Neutral/Away), opponent's name, team's score, opponent's score and the date are listed.
The other change was to include the rankings from six other metrics at the top. Those numbers have been available to the committee for a few years now, but on a separate spreadsheet. They were added here to make it easier for committee members to see all the data in one place.
Note what is not included on the team sheets:
- Conference record and standings: There is a long held belief that how you do in your conference matters, but it doesn't. The only conference data on this page is a team's strength of schedule within its conference. That is a relatively recent addition resulting from nearly every conference having an unbalanced schedule.
- Ken Pomeroy groupings:I cannot tell you how often I see people arguing for or against a team based how they have done based on some arbitrary grouping of teams in Pomeroy's rankings. And by arbitrary, I mean people draw lines wherever it suits them ("they have three sub-90 losses in KenPom"). As you can see, the committee does not consider that at all. All groupings are RPI-based.
- Record in last X-number of games: A long time ago, the committee used to consider how a team finished the season and included a team's record in its most recent 12 games. Before that, it was 10 games. However, that was removed over a decade ago when the committee decided that it was necessary to take a more holistic approach to the season. Now, games in November mean just as much as games in March.
So, please continue the debate on which teams should be in the Big Dance and where they should be seeded. Just be sure to debate with information that matters - and it's pretty clear what matters to the selection committee.