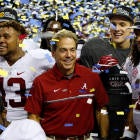
In Mike Shula's final season as Alabama's coach in 2006, the Crimson Tide's athletic department made $87.6 million. That was a lot of money in college sports back then.
Ten years later -- and since Nick Saban arrived -- that amount (when factoring inflation) would compare to Louisville and Washington's revenue outside the top 20 nationally. Alabama reported making $148.9 million for 2014-15 (the most recent year available). That's nothing compared to fellow College Football Playoff participant Ohio State, which made $167.2 million.
Ohio State and Alabama won the national championship the first two years of the CFP, and they're in contention again. Elite coaches (Urban Meyer and Saban) helped put them in that position. The interesting question: How much is money also dictating who wins the national title?
While Ohio State and Alabama ranked in the top five for revenue in 2014-15, Washington was 23rd ($104.4 million) and Clemson was 39th ($83.5 million), according to USA Today's financial database. Since 2005, no school has won football's national championship while ranked outside the top 20 in total athletic revenue.
That doesn't mean it's impossible. Clemson came close to beating Alabama last year in the title game. Florida State won the BCS title in 2013 while at the bottom of the top 20 in revenue. Money isn't buying Texas much success lately, proving that schools need more than just dollars to win. They also need sense.
Yet when Ohio State and Clemson play in the Fiesta Bowl, the Buckeyes will have double the athletic revenue of Clemson, which sponsors far fewer sports and thus many fewer athletes. That large gap in revenue would be like Clemson playing New Mexico for a spot in the national championship.
But a deeper dive at the four CFP teams' financial numbers shows how Clemson competes by spending heavily on football compared to the heavyweights. Clemson spent $100,000 more than Alabama in 2014-15 on both football support staff and assistant coach salaries. Ohio State trailed Alabama and Clemson, and Washington was even farther behind.
Still, there's this: Ohio State, Clemson and Washington all reported their football expenses between $27 million-$29 million in 2014-15; Alabama listed its football costs at $48.3 million. Of course, the Buckeyes beat the Crimson Tide that year in the semifinals.
How do this year's four CFP teams make and spend money?
CBS Sports analyzed each school's 2014-15 NCAA financial reports and other documents for answers. NCAA reports from 2015-16 are not available yet, so most of the numbers below are on a two-year lag. Unless otherwise noted, all of the figures are from the 2014-15 reports the schools submitted to the NCAA.
Finances of College Football Playoff teams
| Category | Alabama | Clemson | Ohio State | Washington |
| Total Operating Athletic Revenue | $148.9 million | $83.5 million | $167.2 million | $103.5 million |
| Total Operating Athletic Expenses | $132.4 million | $82.9 million | $154.0 million | $104.4 million |
| Total Athletic Revenue (2005-15)* | $1.27 billion | $679.6 million | $1.39 billion | $775.8 million |
| Sports | 21 | 19 | 36 | 22 |
| Scholarship Athletes | 452 | 385 | 724 | 404 |
| Annual Debt for Athletic Facilities | $15.2 million | $2.1 million | $28.6 million | $15.8 million |
| Football Ticket Sales | $36.9 million | $19.7 million | $52.2 million | $21.4 million |
| Donations to Athletic Department | $29.4 million | $19.7 million | $33.0 million | $22.8 million |
| Direct Institutional Support | $6.1 million | $4.2 million | $75,470 | $3.9 million |
| Athletic Department Money Transferred to University | $5.3 million | $0 | $75,470 | $0 |
| Student Fee Revenue | $0 | $0 | $0 | $0 |
| NCAA Revenue | $2.0 million | $2.7 million | $4.7 million | $3.1 million |
| Media Rights (Radio, TV, Digital, etc.) | $35.0 million | $15.4 million | $24.8 million | $26.3 million |
| Media Rights Attributed to Football | 57% | 75% | 64% | 89% |
| Additional Conference Revenue (non-media/bowl) | $8.4 million | $6.9 million | $4.4 million | $456,750 |
| Royalties, Licensing, Advertising, Sponsorships | $11.2 million | $8.1 million | $17.1 million | $12.7 million |
| Football Camp Revenue | $590,661 | $652,330 | $644,961 | $56,306 |
| Nike 2016-17 Contract Value | $3.8 million | $2.7 million | $6.2 million | $3.7 million |
| Football Scholarship Costs | $4.0 million | $4.0 million | $4.1 million | $3.5 million |
| Players on Athletic Aid | 116 | 105 | 86 | 91 |
| Football Scholarship Value Per Player | $34,121 | $37,908 | $47,222 | $38,051 |
| Football Head Coach Pay in 2016* | Nick Saban, $6.9M | Dabo Swinney, $4.4M | Urban Meyer, $6.1M | Chris Petersen, $3.6M |
| Max 2016 Bonus for Head Coach* | $700,000 | $1.7 million | $775,000 | $1.2 million |
| Football 2016 Assistant Coaches Pay* | $5.3 million | $5.4 million | $4.6 million | $3.6 million |
| Football Support Staff Pay | $3.2 million | $3.3 million | $3.0 million | $2.4 million |
| Football Recruiting Expenses | $1.3 million | $884,960 | $614,619 | $452,610 |
| Recruiting Expenses Attributed to Football | 60% | 52% | 33% | 33% |
| Athletic Department Medical Expenses/Insurance | $3.0 million | $766,733 | $1.3 million | $1.3 million |
| Football Medical Costs/Insurance Per Player | $11,904 | $1,649 | Not available^ | $5,418 |
| Total Expenses Attributed to Football | $48.3 million | $27.3 million | $29.2 million | $29.1 million |
| * via USA Today | # via Portland Business Journal ^ OSU reported medical/insurance costs for the entire athletic department, not by sport. | ||||