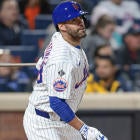
The injury bug has spread throughout major league infields like a bad cold making its way around an airplane cabin. Orlando Hudson, Evan Longoria, Mike Lowell and Joe Crede are just some of the infielders who are spending some quality time on the DL. Some of their replacements have played surprisingly well, but all are not necessarily cut out for mixed Fantasy league stardom. Sean Casey, for example, is batting .350 and will get a chance to produce more RBI and runs with Kevin Youkilis moving over to third base to fill in for Lowell. While Casey has always hit well for average, he is not likely to sustain his 40 percent H/BIP rate due to his complete lack of power and speed. Most likely, he will provide owners with a .300 average and little else from here on out.
Red Sox teammate Jed Lowrie has done a nice job replacing the injured Julio Lugo, hitting .310 with 13 doubles in just 129 at-bats. He has shown decent home run power in the minors, at least for a middle infielder, but it has yet to appear in the big leagues. It's unlikely that Lowrie will continue to hit over .300 as he, too, has benefited from a suspiciously-high H/BIP. An empty .280 average is about the best we expect from Lowrie going forward.
Other replacement infielders have been disappointing, but could actually be worth picking up. Chris Burke and his .204 average look inadequate for the task of replacing Orlando Hudson, but his power and contact indicators from the past few seasons are just a shade below those of Hudson. Burke could easily hit around .270 with 20 runs scored and half a dozen steals over the last six weeks of the season. This might be hard to believe after seeing his current stats, but those numbers have been dampened by his 24 percent H/BIP.
Willy Aybar's struggles with health and off-the-field issues have made people forget that he was once a prized prospect, and this year's bad luck with H/BIP (24 percent) isn't helping matters. Sitting behind Evan Longoria on the depth chart also doesn't do much for one's comeback chances. This year, however, he has shown the ability to hit for power and contact that he demonstrated in the minors. With better luck, he could make the most of his opportunity to play in Longoria's place. Aybar may be hitting just .231 right now, but he could be useful in mixed leagues down the stretch. If other third base alternatives, like Ty Wigginton, Chase Headley or Ian Stewart, are unavailable, Aybar will probably be there for the taking. He is rostered in just four percent of CBSSports.com leagues.
All statistics below are for season-to-date performances through Friday, August 15.
| 'Lucky' Hitters | H/BIP | RC/27 | 'Lucky' Pitchers | H/BIP | ERC |
| Ian Stewart, 3B, Colorado | 40% | 7.3 | Jeff Karstens, SP, Pittsburgh | 18% | 1.94 |
| Sean Casey, 1B, Boston | 40% | 6.9 | Justin Masterson, SP, Boston | 23% | 3.53 |
| Jerry Hairston, OF Cincinnati | 39% | 7.7 | Justin Duchscherer, SP, Oakland | 24% | 2.30 |
| Howie Kendrick, 2B, L.A. Angels | 38% | 5.8 | Jeff Samardzija, RP, Chicago Cubs | 24% | 1.14 |
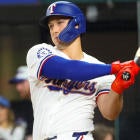
| Ramon Vazquez, 3B, Texas | 38% | 6.5 | Armando Galarraga, SP, Detroit | 24% | 2.99 |
| Jed Lowrie, SS, Boston | 38% | 5.9 | Kevin Gregg, RP, Florida | 24% | 2.57 |
| Fred Lewis, OF, San Francisco | 37% | 6.1 | Joe Saunders, SP, L.A. Angels | 25% | 3.17 |
| Mike Aviles, SS, Kansas City | 36% | 6.4 | Daisuke Matsuzaka, SP, Boston | 26% | 3.38 |
| Kelly Shoppach, C, Cleveland | 36% | 5.7 | John Grabow, RP, Pittsburgh | 26% | 3.64 |
| Darin Erstad, OF, Houston | 35% | 4.3 | Jason T. Davis, RP, Pittsburgh | 27% | 2.66 |
| Unlucky' Hitters | H/BIP | RC/27 | 'Unlucky' Pitchers | H/BIP | ERC |
| Travis Metcalf, 3B, Texas | 17% | 1.4 | Clay Buchholz, SP, Boston | 36% | 6.28 |
| Andy LaRoche, 3B, Pittsburgh | 18% | 2.6 | Jorge De La Rosa, SP, Colorado | 36% | 5.51 |
| Corey Patterson, OF, Cincinnati | 20% | 2.4 | Nate Robertson, SP, Detroit | 35% | 5.82 |
| Nomar Garciaparra, 1B, L.A. Dodgers | 23% | 3.7 | Carlos Silva, SP, Seattle | 34% | 5.68 |
| Juan Rivera, OF, L.A. Angels | 23% | 4.2 | Bronson Arroyo, SP, Cincinnati | 34% | 5.48 |
| Mike Napoli, C, L.A. Angels | 23% | 5.9 | Aaron Harang, SP, Cincinnati | 34% | 5.02 |
| Geoff Blum, 2B, Houston | 23% | 3.9 | Darrell Rasner, SP, N.Y. Yankees | 33% | 5.13 |
| Chris Burke, 2B, Arizona | 24% | 3.2 | Brian Wilson, RP, San Francisco | 33% | 3.90 |
| Willy Aybar, 3B, Tampa Bay | 24% | 4.4 | Andy Pettitte, SP, N.Y. Yankees | 33% | 4.33 |
| Brandon Inge, 3B, Detroit | 26% | 4.5 | A.J. Burnett, SP, Toronto | 33% | 4.43 |
| Good stats, good skills - hitters | H/BIP | RC/27 | Good stats, good skills - pitchers | H/BIP | ERC |
| Aubrey Huff, 1B, Baltimore | 31% | 7.4 | Mike Gonzalez, RP, Atlanta | 28% | 2.90 |
| Conor Jackson, 1B, Arizona | 32% | 6.9 | Rafael Perez, RP, Cleveland | 30% | 3.09 |
| Jody Gerut, OF, San Diego | 31% | 6.2 | Matt Cain, SP, San Francisco | 29% | 3.26 |
| Stephen Drew, SS, Arizona | 32% | 5.7 | B.J. Ryan, RP, Toronto | 28% | 3.38 |
| Melvin Mora, 3B, Baltimore | 29% | 4.9 | Scott Baker, SP, Minnesota | 29% | 3.49 |
| Poor stats, poor skills - hitters | H/BIP | RC/27 | Poor stats, poor skills - pitchers | H/BIP | ERC |
| Freddy Sanchez, 2B, Pittsburgh | 27% | 3.0 | Vicente Padilla, SP, Texas | 30% | 5.27 |
| Michael Bourn, OF, Houston | 28% | 3.2 | Scott Feldman, SP, Texas | 28% | 5.18 |
| Carlos Gomez, OF, Minnesota | 32% | 3.4 | Jeff Suppan, SP, Milwaukee | 30% | 5.04 |
| Juan Uribe, 2B, Chicago White Sox | 28% | 3.4 | Charlie Morton, SP, Atlanta | 29% | 4.82 |
| Ryan Garko, 1B, Cleveland | 28% | 4.0 | Jason Bergmann, SP, Washington | 30% | 4.74 |
|
|
|
Runs Created per 27 Outs (RC/27) -- An estimate of how many
runs a lineup would produce per 27 outs if a particular player
occupied each spot in the order; ex. the RC/27 for Miguel Cabrera
would predict the productivity of a lineup where Cabrera (or his
statistical equal) batted in all nine spots; created by Bill James Component ERA (ERC) -- An estimate of a what a pitcher's ERA would be if it were based solely on actual pitching performance; created by Bill James Base Hits per Balls in Play (H/BIP) -- The percentage of balls in play (at bats minus strikeouts and home runs) that are base hits; research by Voros McCracken and others has established that this rate is largely random and has a norm of approximately 30% Isolated Power -- The difference between slugging percentage and batting average; created by Branch Rickey and Allan Roth Walk Rate -- Walks / (at bats + walks) Whiff Rate -- Strikeouts / at bats |
Al Melchior was recently a Fantasy columnist and data analyst for Baseball HQ and will be providing advice columns for CBSSports.com. Click here to send him a question. Please put "Melchior" in the subject field.