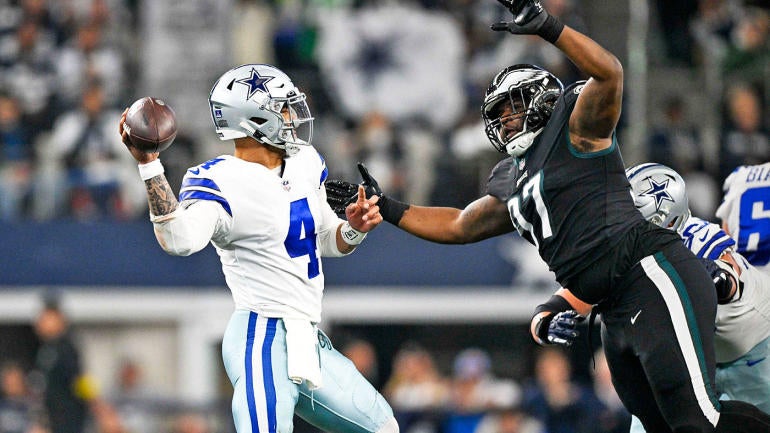
I've always believed that Fantasy Football is all about the matchups, and I've always hated the concept of Strength of Schedule.
One day about four years ago, I thought about what it would take to make a Strength of Schedule that would be beneficial to Fantasy managers.
Obviously it meant analyzing each defense. Because, hello, defenses are what make the matchups.
But it had to be more than that. It meant having to dig into every single defensive player, how they fit into the defensive scheme they're playing in, who they're playing for, who's backing them up, how each team defends certain positions, and so on.
That seemed like a lot of work.
But I tried it. And while it wasn't perfect, it did help.
In the years since I've perfected the process, and while injuries and surprising play -- both in a good way and in a bad way -- will alter how defenses perform, I like the concept of what I've built: The Projected Strength of Schedule (or PSoS) for every position on every team. At minimum, it will give you a potential tiebreaker when debating between two players in your drafts. At most, it's a warning sign to avoid certain position groups across the league.
This article breaks down the methodology and provides the four defensive grades I gave each team. There is no Fantasy Football advice on this page, but there is on related pages for QB, RB, WR and TE that will be published one per day this week.

Fantasy Football Today Newsletter
Know What Your Friends Don't
Get tips, advice and news to win your league - all from the FFT podcast team.
Thanks for signing up!
Keep an eye on your inbox.
Sorry!
There was an error processing your subscription.
For starters
My process began with a collection of team data from the prior year. Not just basic stuff like sacks and turnovers, more like information that provided better context like pass rush pressure rate, missed tackles, red-zone numbers, inside-the-10 numbers, etc. Basically this helped show me how a team may have underachieved and thus will try to improve, or how a team overachieved and may regress the following year.
I find a lot of similar data for individual players, too. For example, pass rushers each had a pass rush win rate that can be used in context with the number of passing-down snaps they play. Pass coverage defenders had all the pass defense data you could ask for including catch rate allowed and QB rating against, both of which can be used in context with the number of intermediate- and deep-target throws they've seen. All defensive players had a missed tackle rate, which isn't a good thing if it's high.
I'll then get a second opinion from Pro Football Focus, which has some data I like. It also has grades for every player. I do not accept their grades as gospel -- there are many instances where a player will have a great grade but some lousy stats, or a terrible grade with some terrific stats. The ultimate tie-breaker is actually watching the players play. Even a little bit of film will help me determine whether I agree or disagree with the grade (admittedly, sometimes I end up watching maybe too much film).
All of this sets the stage for grading four facets of each defense: its pass rush, its run defense, its pass coverage against receivers and its pass coverage against running backs and tight ends. These grades, done simply on a scale of 1-to-10 where 10 is amazing and 1 is beyond bad, are huge for the PSoS process. This year was the first time I used half-grades, so a segment of a defense could get a 9.5 or 6.5, etc.
Making the grade
No one grade from the four facets solely determines whether a team is great, average, bad or somewhere in between. Because elements of every defense have to work together on every play, I blend two grades together in a specific-but-simple formula to create final grades.
I'd like to use the Eagles as an example. This year, based on my research I graded Philadelphia:
- 9.0 for run defense
- 10.0 for pass rush
- 8.5 for pass coverage
- 7.0 for pass coverage against RB/TEs
But it's combinations of those grades that determined how tough they'd make things on their opponents. Here are the blends I use to create the final grades that go into the PSoS.
- QUARTERBACK: 50% of the pass rush grade and 50% of the pass coverage grade. That means 5.0 (for the pass rush) plus 4.25 (for the pass coverage) created a total of 9.25. That's the second-highest grade I gave against QBs this year (Dallas got 9.5). Bad news for everyone who faces the Eagles.
- RUNNING BACK: 90% of the run defense grade and 10% of the pass coverage against RB/TEs. Until running backs start collecting six-plus targets per game en masse, there's no reason to overcompensate a grade based on how a defense covers a running back in the passing game. Most of them just aren't great at it anyway. The tally: 8.1 for the run defense and 0.7 for the pass coverage means a total of 8.8, which means they're projected to be a tough matchup for rushers. Three teams graded higher.
- WIDE RECEIVER: 80% of the pass coverage grade and 20% of the pass rush grade. The argument against using the same blend for WRs as QBs is that defensive backs are much more capable of impacting a play against a receiver than pass rushers are, but pass rushers obviously bring an impact on the quarterback. I settled on this blend this year. The math says 6.8 for the pass coverage and 2.0 for the pass rush, making an 8.8 score for receivers playing Philly. Three teams graded higher.
- TIGHT END: 80% of the RB/TE pass coverage grade and 20% of the pass rush grade. Same formula as for receivers except I used the grade for specific coverage of linebackers and safeties. Yes, there will be times where cornerbacks cover tight ends, but it's not common save for special situations. This formula equated to a 7.6 grade (5.6 for the coverage, 2.0 for the pass rush), which was fifth-best.
What do we do now?
Once each grade is figured out, I apply them to each team's schedule of opponents to form a cumulative grade. Teams are slightly penalized for three-game road trips, playing in Europe or, new for this year, playing multiple Thursday night games on a short week (through Week 12; the NFL will flex Thursday night games starting in Week 13). The higher the grade, the tougher the schedule. Instead of listing some number between 94 and 122, I rank them based on the cumulative total -- the lowest number is 1, the next lowest is 2, and so on.
If your team is ranked No. 1, your team's specific skill position has the easiest PSoS. If your team is ranked No. 32, your team's specific skill position has the hardest PSoS. This year it just so happens that the same team has the hardest PSoS in every single category. Hint: They play the Eagles twice.
You now know how I come up with a Projected Strength of Schedule for every position on every team. If you're reading this and feeling exhausted, I don't blame you. Imagine doing the research for it!
The grades!
Here are my defensive grades for each defense by category as of the start of 2023 training camp. If you're looking for offensive PSoS then check here for QB, RB, WR and TE.
Defensive grades: Pass rush
| PHI | 10 | MIN | 7 |
| DAL | 9 | NYG | 7 |
| SF | 9 | CAR | 6.5 |
| BUF | 8.5 | LAR | 6.5 |
| CLE | 8.5 | NO | 6.5 |
| KC | 8.5 | TB | 6.5 |
| MIA | 8.5 | ATL | 6 |
| GB | 8 | DEN | 6 |
| NE | 8 | DET | 6 |
| NYJ | 8 | SEA | 6 |
| WAS | 8 | TEN | 6 |
| BAL | 7.5 | HOU | 5.5 |
| CIN | 7.5 | JAC | 5.5 |
| LV | 7.5 | IND | 5 |
| PIT | 7.5 | ARI | 3.5 |
| LAC | 7 | CHI | 2.5 |
Defensive grades: Pass coverage
| DAL | 10 | KC | 6.5 |
| BUF | 9 | LAC | 6.5 |
| MIA | 9 | WAS | 6.5 |
| PHI | 8.5 | DET | 6 |
| NE | 8 | NYG | 6 |
| NYJ | 8 | PIT | 6 |
| SF | 8 | HOU | 5.5 |
| CIN | 7.5 | TEN | 5.5 |
| DEN | 7.5 | ATL | 5 |
| GB | 7.5 | JAC | 5 |
| NO | 7.5 | CHI | 4.5 |
| BAL | 7 | LAR | 4 |
| CLE | 7 | IND | 3.5 |
| SEA | 7 | MIN | 3.5 |
| TB | 7 | ARI | 3 |
| CAR | 6.5 | LV | 3 |
Defensive grades: Pass coverage vs. RB/TE
| DAL | 9.5 | GB | 6 |
| BUF | 9 | DEN | 5.5 |
| SF | 9 | PIT | 5 |
| NO | 8.5 | SEA | 5 |
| BAL | 7.5 | TEN | 5 |
| CAR | 7.5 | DET | 4.5 |
| CIN | 7 | LAR | 4.5 |
| LAC | 7 | NYJ | 4.5 |
| NE | 7 | MIA | 4 |
| PHI | 7 | MIN | 4 |
| WAS | 7 | NYG | 4 |
| ATL | 6.5 | ARI | 3.5 |
| CHI | 6.5 | JAC | 3.5 |
| CLE | 6.5 | HOU | 3 |
| KC | 6.5 | LV | 3 |
| TB | 6.5 | IND | 2 |
Defensive grades: Run defense
| SF | 10 | LAR | 6.5 |
| DAL | 9.5 | NYG | 6.5 |
| BAL | 9 | DET | 6 |
| NE | 9 | GB | 6 |
| PHI | 9 | MIN | 6 |
| NO | 8.5 | PIT | 6 |
| CIN | 8 | TEN | 6 |
| MIA | 8 | DEN | 5.5 |
| NYJ | 7.5 | IND | 5.5 |
| WAS | 7.5 | JAC | 5.5 |
| BUF | 7 | SEA | 5.5 |
| CLE | 7 | CHI | 5 |
| KC | 7 | LAC | 5 |
| TB | 7 | LV | 5 |
| ATL | 6.5 | HOU | 4 |
| CAR | 6.5 | ARI | 2 |
This article appears in the CBS Sports/Beckett Sports 2023 Fantasy Football Magazine. Pick up your copy at newsstands in mid-August.


