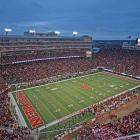
Major-college football experienced its largest per-game attendance drop in 34 years and second-largest ever, according to recently released NCAA figures.
Attendance among the 129 Football Bowl Subdivision (FBS) teams in 2017 was down an average of 1,409 fans per game from 2016. That marked the largest drop since 1983 when average attendance declined 1,527 fans per game from 1982.
The 2017 FBS average of 42,203 fans per game is the lowest since 1997.
That average attendance drop marked the second-sharpest decline since the NCAA began keeping track of college football attendance in 1948. For the first time in history, average attendance declined nationally for four consecutive seasons.
The 2017 numbers include FBS home games, neutral-site games, bowl games and the College Football Playoff.
Since establishing an all-time high average attendance in 2008 (46,971), FBS attendance has slipped a record 10.1 percent over the last nine years.
Largest average attendance drops in major college football
| Year | Attendance | Year Prior | Difference | Change |
|---|---|---|---|---|
1983 | 42,162 | 43,689 | -1,527 | -3.50% |
2017 | 42,203 | 43,612 | -1,409 | -3.23% |
2014 | 44,603 | 45,671 | -1,068 | -2.33% |
1992 | 41,170 | 42,043 | -873 | -2.07% |
2015 | 43,933 | 44,603 | -670 | -1.50% |
2009 | 46,281 | 46,971 | -691 | -1.47% |
2012 | 45,440 | 46,074 | -634 | -1.38% |
1988 | 41,454 | 41,963 | -509 | -1.21% |
2011 | 46,074 | 46,632 | -558 | -1.20% |
1985 | 42,040 | 41,454 | -508 | -1.19% |
Even the most rabid league in the country saw a dip. In 2017, the SEC experienced its sharpest per-game decline -- down an average 2,433 fans -- since 1992. That figure led the Power Five in fans lost per game in 2017.
While the SEC led all FBS conferences in average attendance for the 20th consecutive year, its average attendance (75,074) was the lowest since 2005. The SEC has slipped an average of 2,926 fans per game (3.7 percent) since a record 78,630 average in 2015.
College sports has long been at odds with how to manage the time/value relationship. In other words, how to make attendance at a live event more valuable than the alternatives, which range from remaining at a tailgate outside the venue to viewing on a smartphone while on the go to watching in the comfort of one's living room.
"It's a technology issue," said Wright Waters, Football Bowl Association executive director and former Sun Belt commissioner. "The public is ahead of us every day in what they can get from technology. We have not been able to keep up."
One former Power Five athletic director called it a "societal shift" leading the powers that be scrambling to figure out the viewing habits of millennials as well as well-heeled alumni.
"This is not surprising to me," said Bill Lutzen, a veteran sports TV programmer who is currently the CFO of a web optimization firm. "This issue is with lack of involvement of the college students. They no longer view attending sporting events as part of the university experience."
Power Five average attendance changes
| Conference | 2017 | 2016 | Difference | Change |
|---|---|---|---|---|
SEC | 75,704 | 77,507 | -2,433 | -3.14% |
ACC | 48,442 | 49,734 | -1,292 | -2.59% |
Big 12 | 56,852 | 57,531 | -679 | -1.12% |
Pac-12 | 49,601 | 50,073 | -472 | -0.09% |
Big Ten | 66,227 | 66,151 | 76 | 0.01% |
Student attendance had decreased 7 percent since 2009, Wall Street Journal found in 2014.
Despite leading the nation in average attendance each year since 1997, Michigan has had issues recently selling student tickets.
One Power Five source suggested the NFL and MLB have been much more proactive in downsizing stadiums to create a more premium ticket.
Arizona State, Kentucky, North Carolina and Penn State are all in the process of downsizing stadiums. In marketing circles, that creates a more intimate experience. Marketers continue to struggle to find a successful balance in stadiums. Across all leagues, that means making the game experience as close to that living room experience as possible.
AT&T Stadium in Arlington, Texas, and Mercedes-Benz Stadium in Atlanta have created in-house lounges so extravagant it's actually better watching on a cinema-quality screen with drink in hand than stepping out to view the real thing a few feet away.
"Does the experience and cost outweigh the convenience of watching it at home?" asked Brian Cockerham, vice president of PrimeSport, which sells travel and ticket packages to pro and college events. "That is why you are seeing several schools decrease capacity and [others] look to decrease capacity and look to increase the experience and amenities."
Some of the slippage nationally can be attributed to the growth of the FBS. In recent years, FCS schools with smaller fan bases and stadiums have moved up to FBS. Since 1988, Division I-A/FBS has grown by almost a quarter from 104 schools to 129 in 2018. Example: Georgia Southern last year drew a hurricane-impacted crowd of 3,387 vs. New Hampshire.
But across all divisions, 1,693,661 fewer fans attended games in 2017 compared to 2016. That's the biggest per-year drop since 2004. Although the average decline for FBS, FCS, Divisions II and III was only 380 fewer fans per game, that marks the sharpest year-over-year drop since 1993.
Bowl game attendance also declined for the seventh straight year to an average of 40,506 in the 40 games. That marks a 23 percent drop-off in average bowl attendance since 2010.
"Are we concerned about it?" Waters asked. "You're damn right."
Waters said a mitigating factor in bowl attendance dip is an expansion in recent years to several smaller venues.
The total of 47.6 million fans who attended NCAA football in 2017 is down almost 2.7 million fans (5.3 percent) since an all-time high of 50.3 million in 2013.
In fact, there were indicators across the board that fewer fans are paying the price of admission to actually watch games.
- Despite an uptick in the number of teams playing NCAA football (666), the total amount of fans (47.6 million) were the fewest since 2005.
- In the latest realignment era (since 2012), Power Five conference attendance is down an average aggregate of 11,383 fans per game. Only the SEC is up in average attendance (+128) during that six-year period.
- The Pac-12 has experienced the biggest overall drop of any Power Five league: 4,078 fans per game since 2012. Its 2017 average of 49,601 is the conference's lowest average attendance since 2001.
- The ACC experienced its lowest average attendance (48,442) since 1999 (45,073). The 2017 figure was the lowest among Power Five conferences for the 13th straight year.
- Only the Big Ten and Mountain West had average per-game increases in attendance from 2016. In once again leading FBS in attendance, Michigan (111,589 per game) posted the six largest crowds of 2017.
- Purdue had the largest attendance increase (up 13,433 per game) going from 34,451 in 2016 to 47,884 in 2017. The Boilermakers won seven games for the first time since 2011.
Average FBS attendance since 2008
| Year | Attendance | YOY Difference | Change |
|---|---|---|---|
2017 | 42,203* | -1,409 | -3.23% |
2016 | 43,612 | -321 | -0.07% |
2015 | 43,933 | -670 | -1.50% |
2014 | 44,603 | -1,068 | -2.33% |
2013 | 45,671 | 231 | 0.05% |
2012 | 45,440 | -634 | -1.38% |
2011 | 46,074 | -558 | -1.20% |
2010 | 46,632 | 351 | 0.07% |
2009 | 46,281 | -691 | -1.47% |
2008 | 46,971^ | 9 | 0.002% |
* Lowest since 1997 | ^ All-time high


