In this column, Ariel Cohen introduces his Replacement Level Drafting system, his process of making sure he's taking the most valuable player at each spot of the draft. Here, he explains the logic and process behind the system. To put the process to use yourself, head over to SportsLine.com and download the tool here.
In my previous piece at SportsLine.com, I showed you how to successfully convert player projections into auction dollars.
But what if you are not playing in an auction? What if your league drafts its players using a standard snake draft format?
Why would you need to calculate auction dollars? Isn't a ranking good enough?
Today, I will introduce a new technique — a method that will help Fantasy players acquire as much value as possible when building rosters. For this approach, it is necessary to have formulated player auction values. You can find those here.
I call this method - Replacement Level Drafting (RLD). Here's how to do it.
Consider the following hypothetical league:
- There are only 2 teams playing.
- Each team selects one 1B and one SS.
- There is only one scoring category — RBIs.
- Players are selected by way of serpentine draft.
- Your team has the first pick (and the 4th pick).
The following are the projected RBIs for the top first basemen and shortstops available:
1B Options | SS Options | |||||||
Position | Name | RBI | Drop | Position | Name | RBI | Drop | |
1B | Allen Albert | 100 | 0 | SS | Chuck Cam | 50 | 0 | |
1B | Bob Barker | 90 | 10 | SS | David Disco | 20 | 30 | |
Who do you select first?
On first glance, you may be inclined to choose Allen Albert, since he has the highest projected RBI total at 100. However, that would be unwise.
Let's see why…
If you draft Allen Albert, the other Fantasy team will then choose Bob Barker and Chuck Cam. You would wind up with David Disco. Let's check out the resulting projected RBI totals:
Your Fantasy Team | Other Fantasy Team | |||||
Position | Name | RBI | Position | Name | RBI | |
1B | Allen Albert | 100 | 1B | Bob Barker | 90 | |
SS | David Disco | 20 | SS | Chuck Cam | 50 | |
All | Total Projected | 120 | All | Total Projected | 140 | |
Your team only ended up with 120 projected RBIs, whereas your opponent finished with 140.
How did that happen if we drafted the top player?
The key is to take a look at the value lost by replacing your top options at each position. It is the marginal value that is important.
The "drop" between Albert and Barker at first base — is only 10, whereas the "drop" between Cam and Disco at shortstop is 30.
1B Options | SS Options | |||||||
Position | Name | RBI | Drop | Position | Name | RBI | Drop | |
1B | Allen Albert | 100 | 0 | SS | Chuck Cam | 50 | 0 | |
1B | Bob Barker | 90 | 10 | SS | David Disco | 20 | 30 | |
Since each team is guaranteed to acquire at least one player at each position, the prudent drafting strategy is to attack the position which would have the largest drop in replacement value.
If you had selected Chuck Cam first, despite that he only has the 3rd most projected RBIs, you would have acquired more value in the aggregate than your opponent.
Moving on from this hypothetical example to our real-life leagues, we can extend this logic as we navigate through our deeper serpentine drafts.
Recently, I was part of a CBS Sports mock draft — 12 Team Head-To-Head Category Mock. I used the Replacement Level Drafting (RLD) method to help elect which players to draft. To illustrate how RLD works, I will run through some of the decision points that arose during this mock. Here goes …
Target Player Depth:
I had the 5th pick of 12 teams in the mock. After an odd round selection, there would be 15 more picks before my next turn. After an even round selection, there would be 9 picks before I would be given another chance.
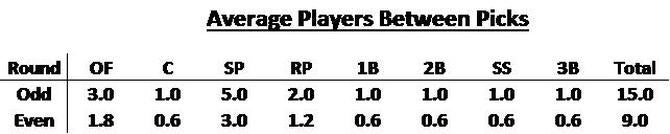
The starting positions for this league were given as: C, 1B, 2B, SS, 3B, 3 OF, U, 5 SP, 2 RP. On average I would expect the following number of players per position selected between picks:
To include some uncertainty - it is possible that 6 SPs or 2 2B would be taken after my odd round selection, for example - I add in an extra fraction of a player per position [an extra .2 to .3].
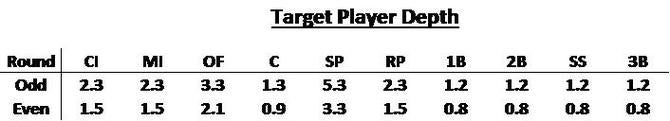
I call the matrix above the Target Player Depth. In the theoretical example, we only looked at the "drop" in auction value for the next available player at each position. However, in a league with many teams / multiple positions / multiple players taken at each position — you will need to look at potentially dropping down further on your list.
For odd rounds, since there may be 3 or 4 outfielders taken between picks as shown above (3.3 average), you will need to look down 3 or 4 spots in the outfielder pool to determine the opportunity cost of replacement.
One note — It is helpful to also take a look at the corner infield (CI) and middle infield (MI) specific positions, which group 1B/3B and 2B/SS together. This particular league does not have a specific slot for CI/MI, but you should generally be accustomed to making such a calculation. I have included it in this article for educational purposes.
1st Round RLD:
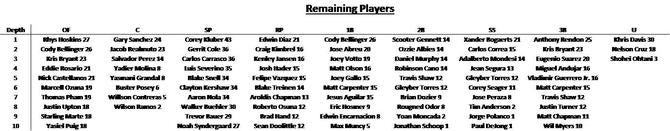
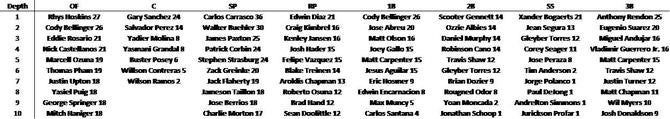
My first step in preparing for this draft was to calculate player auction dollars, specifically tailored to this format. When the draft came to my turn in the first round, I saw the following board of players available (according to my values):
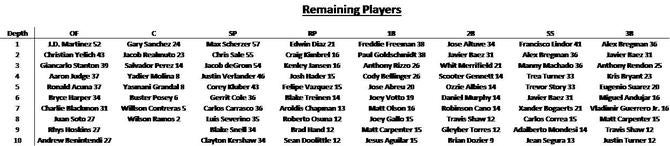
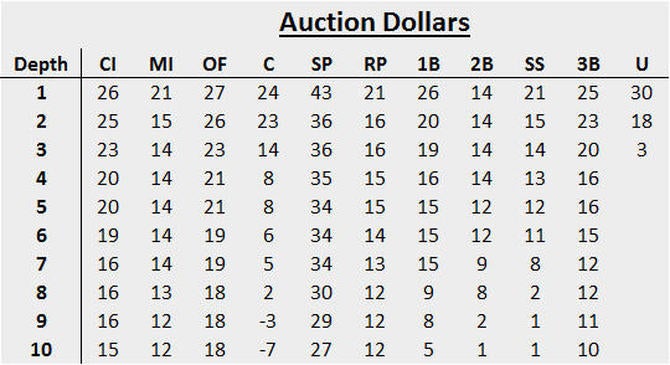
Taking the names away, the auction dollar distribution looked as follows:
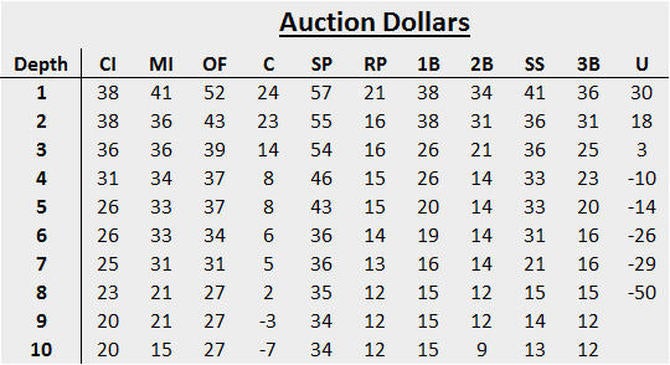
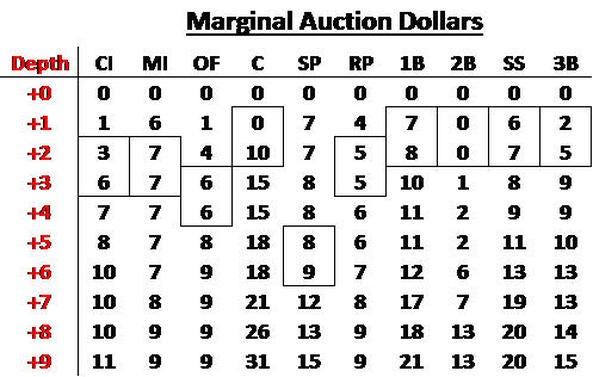
Let's define the marginal auction dollars as the difference to the nth player at each position, from the top player available. The marginal auction dollars looked as follows:
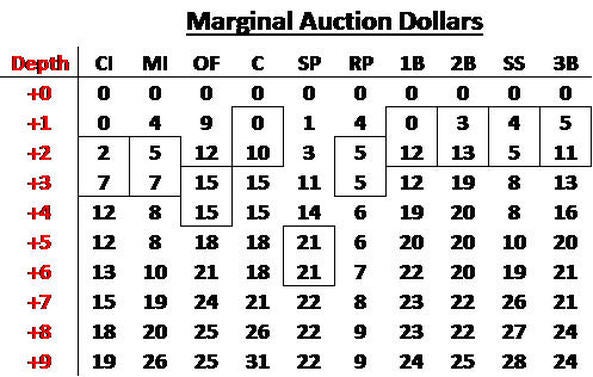
For example, the marginal auction dollars for dropping 4 spots at third base (the +4 Depth at 3B) is:
Alex Bregman $36 — Eugenio Suarez $20 = $16
[Third Base #1 — Third Base #5 = $36 - $20 = $16]
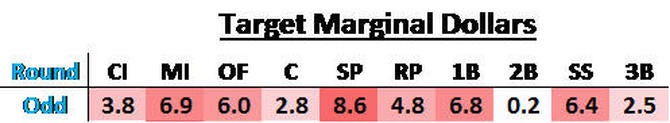
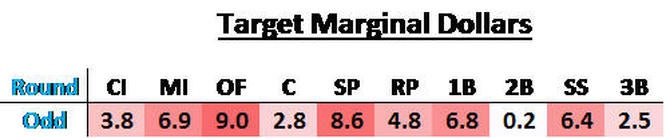
Looking at the target player depth for the odd rounds (boxed in above), the following are the target marginal dollars by each position:
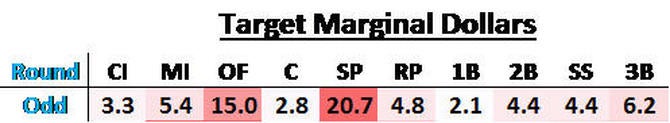
For outfielders, we are looking down 3-4 spots — which is a $15 drop in player value. For starting pitchers, we are looking down 5-6 spots, which is a $21 drop in auction value. The catcher drop comes out to about $3, first baseman $2, second basemen $4, etc.
The key concept of RLD - In terms of players, I had the following options available to me:
- If I didn't draft Max Scherzer ($57), I might have Cole/Carrasco ($36) available — which is a $21 drop.
- If I didn't draft J.D. Martinez ($52), I might have Judge/Acuna ($37) available — which is a $15 drop.
- If I didn't draft Gary Sanchez ($24), I might have Realmuto($23)/Perez($14) available — which is [linearly interpolated] an average of a $3 drop.
- etc.
The starting pitcher was the position that had the largest replacement level dollars ($21). I selected Max Scherzer with the 5th overall selection as my 1st round pick.
3rd Round RLD:
After selecting Giancarlo Stanton in round #2, here is another example of how RLD works from later in the draft. Jumping to the 3rd round, I had the following player board available to me:
The auction values, marginal auction dollars and target replacement dollars were:
According to RLD - The positions to be drafted next seemed to be ordered: SP $9, 1B $7, SS $6, OF $6, etc.
Normally, following the RLD method, one would immediately choose the starting pitcher. However, we haven't accounted yet for the Utility players column — the players who don't have a regular position. Notice that Khris Davis was still available and valued at $30. For all intents and purposes, Davis — who may gain outfield eligibility sometime during the season, should be treated as an outfielder.
Let's adjust the chart to account for Khris Davis as a regular OF:
With the highest OF on the board previously at $27, adding Khris Davis to the list pushed the OF marginal auction dollars up by $3, and now made the outfield position the category with the largest marginal value.
Even though Corey Kluber ($43) was the highest valued player on the board, I drafted Khris Davis as my 3rd round selection.
4th Round RLD:
One final illustration, an easy one according to RLD — was my 4th round decision. Here was the available draft board:
The accompanying target marginal dollars, now for even rounds (shorter targeted depths) calculated to:
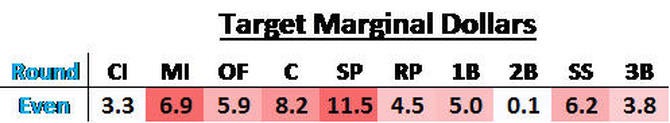
The catcher position was now starting to creep up to be the 2nd highest marginal position. However, the starting pitcher opportunity value loss was indeed the strongest.
I immediately chose Carlos Carrasco as my 4th round pick. That gave me two starting pitchers, an outfielder and a utility player in my first four selections (Scherzer, Carrasco, Stanton & K Davis). These players formed an excellent base for my pitching, and a fantastic power base for the hitting. To this point I am lacking in stolen bases, but overall, I have acquired excellent value.
Using my projections - Below are the total accumulated values that I have calculated for the twelve individual teams through the first four completed rounds:
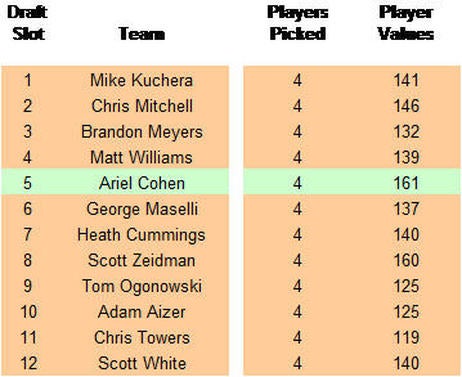
My team had the highest aggregated player values (auction values), with Scott Zeidman a close second.
Of course, these values are based solely upon my own projections and valuations. The other teams undoubtedly used their own methods and might have perceived my team as merely average. But that's okay. The idea is to maximize value according to our own methods and valuations.
Replacement Level Drafting is a great tool to help get you through your drafts, to maximize accumulated player values, and to help you win your Fantasy leagues.
Additional Notes:
- In a Rotisserie league, teams additionally have the complexity of balancing one's roster in terms of statistics, which is not explicitly addressed in this article. If there are two players with similar target marginal values from different positions, one can choose to draft the player which provides the team with more of a complementary statistical balance.
- Many people have asked me — When is the proper time to draft a catcher? RLD provides a clear answer for this … it is the point in the draft where the catcher position has the greatest opportunity marginal value. We saw that in the 4th round (above) the catcher position was getting close to becoming the top priority. Just a few picks later - Chris Mitchell, in fact, snagged the next available catcher (Gary Sanchez) with his round 5.2 pick. If the catcher position comes up in RLD as the "hottest" position — then it is time to draft a catcher.
- Replacement Level Drafting is a tool, but not a be-all/end-all. You still need to do proper research and pay attention to players' average draft position (ADP). You may not want to draft players who are likely to be available many rounds later. The league you are in may tend to draft closers a bit earlier then they should, etc. You always need to keep up with league's dynamics, but the RLD process can assist you with your decision making.