The 2023 MLB season is just about a week old and we've learned so much already. The Rays are the best team since the 1998 Yankees, the Astros and Phillies are doomed, Adam Duvall and Brian Anderson are the best hitters in baseball, etc. OK, that's not how this sport works, but it has been a fun and eventful first few days of the season.
This is a landmark season for MLB. The league implemented several new rules that, in the simplest terms, are designed to make more stuff happen. Less waiting around for something to happen and more stuff happening, basically. There's a pitch timer, extreme shifts are banned, and the bases themselves are larger. Here's everything you need to know about the new rules.
Now that we're about a week into the season, let's take a look at how the new rules are impacting the game, shall we? We shall.
A greatly improved pace
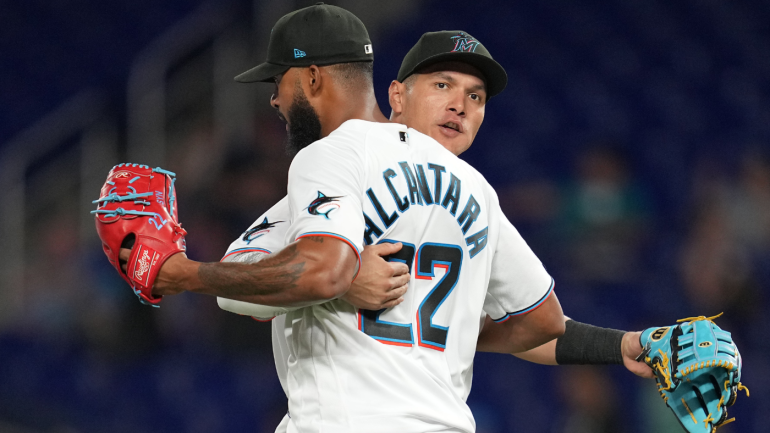
Tuesday night the Marlins and Twins played a throwback game in Miami. Reigning NL Cy Young winner Sandy Alcantara tossed a three-hit shutout in the 1-0 win and the game took only 1:57. There was one sub-2:00 nine-inning game from 2020-22 (the Cardinals and Rays played a 1:54 game last June 9) and there were only three such games from 2016-22.
There have been 3682 days over the last 35 seasons on which at least 14 MLB games were played.
— OptaSTATS (@OptaSTATS) April 5, 2023
The average time of game today (2:33) was the shortest out of any of them.
Thanks largely to the pitch timer, the average time of game is down to 2:38 per nine innings this season. It was 3:03 last season and 2:38 is the lowest since 1984 (2:35). The pitch timer -- 15 seconds with the bases empty and 20 seconds with runners on -- is not really about time of game though. It's about reducing dead time within games, and shorter games are a byproduct.
Here, via Statcast, are the "pace" numbers early this season. This is the average time between pitches within a single at-bat, so not counting the final pitch of one at-bat and the first pitch of the next at-bat:
- 2019: 22.9 seconds
- 2020: 23.2 seconds
- 2021: 23.7 seconds
- 2022: 23.1 seconds
- 2023: 18.6 seconds
The dip from 2021 to 2022 can be attributed to PitchCom. Not everyone used it, but many pitchers did, and the system allowed them to skip looking in to the catcher for the signs. That improved the game's pace a tad.
Look at that 2023 number though! Statcast launched in 2015 and 18.6 seconds is far and away the lowest pace on record. The previous record low was 22.5 seconds in 2018. The league's pace is down 4.5 seconds per pitch. That's 4.5 fewer seconds of the pitcher fidgeting around, the hitter adjusting his batting gloves, and crowd shots of fans looking at their phones.
It's also 4.5 fewer seconds of tension in the late innings of close games. That tension hasn't been eliminated though. It still exists, only in a condensed state. To each his own, but to me a few extra seconds of tension late in the game isn't worth a lot of extra seconds of guys standing around earlier in the game. The late innings haven't lacked excitement thus far.
As for pitch timer violations, teams are averaging 0.80 violations per game in the early going, with the majority going to pitchers (particularly relievers). On Tuesday, Manny Machado became the first player ejected for arguing a pitch timer violation, though he argued he called time before being hit with the violation, not the violation itself.
Teams averaged close to 1.50 pitch timer violations per game the first week of spring training, and have gradually whittled it down to 0.80. That number will never be zero, though it will come down more as players adjust. In Triple-A last season, teams averaged close to two violations per game the first week of the season, and were down to one violation every other game a few weeks later.
The pitch timer is working exactly as intended in the early going of the new season. There is less downtime between pitches and the game flows much better, and, as a result, games are shorter. On average, they're 25 minutes shorter than last season. That's 25 minutes to do literally anything else with your life.
The limit on extreme shifts
The new anti-shift rules will be the most difficult rule change to evaluate throughout the season. I can tell you this much: offense is up in the early going. The league is hitting .250/.323/.413 with a .297 BABIP at the moment. Through the first six days last year, it was .231/.312/.379 with a .279 BABIP. BABIP, or batting average on balls in play, is up significantly, though in an unusual way:
BABIP is up. But also, it's up in kind of some dumb ways. Maybe catch a pop-up or two. pic.twitter.com/czI2mVXtpk
— Mike Petriello (@mike_petriello) April 3, 2023
Left-handed hitters, the hitters most impacted by the shift, have a .246/.328/.421 batting line with a .290 BABIP entering play Wednesday. They had a .229/.323/.362 line with a .274 BABIP the first six days of last season. It's early, but lefties are once again outperforming righties. The opposite was true the last few years because of the shift (mostly).
wOBA by Handedness (normalized each season)
— Tangotiger (@tangotiger) April 5, 2023
Red lines are RHH
bLue are LHH
LHH always had advantage overall, though tide started to shift in 2012.
RHH started to take over both because shift hurt the LHH, but excessive shifting HELPED RHH. 2023 is now back to way it's been pic.twitter.com/zkN0JIYmMN
We know offense is up, particularly among left-handed batters. The "why" is more difficult to answer. How much of this is the limit on extreme shifts? Home runs are way up in the early going. The weather has been unseasonably warm in the Northeast. There are pitchers who may feel rushed by the pitch timer and have seen their execution suffer. There are many potential factors here.
It's unclear how much the limit on extreme shifts is contributing to the increased offense, specifically the increase batting average. That's what we all want, right? Higher batting averages? Hits and balls in play are fun and exciting, and there have been more of them this year than last. I'm certain the anti-shift rules are playing a role in that. How much, exactly? Eh, very hard to say.
Stolen bases are up
Pitchers are now limited to two disengagements (pickoff throw, step off the mound, etc.) per plate appearance and I underestimated how much this would improve the spectator experience. Step offs and pickoff throws are deeply boring (there's a reason the crowd boos pickoff throws). I understand the strategy and their use in holding runners, but reader, they are boring.
Between the limit on pitcher disengagements and the larger bases, runners have more of an upper hand on the basepaths, and they are taking advantage. There have been 101 stolen bases so far this season. There were 61 stolen bases through six days last year. Here are the stolen base numbers:
| Stolen base attempts per game | Stolen base success rate | |
|---|---|---|
2019 | 0.64 | 73% |
2020 | 0.66 | 75% |
2021 | 0.60 | 76% |
2022 | 0.67 | 75% |
2023 | 0.77 | 83% |
An increase of 0.10 attempts per game and eight percentage points of success rate equals a lot -- A LOT -- more steals across the 162-game season. MLB is currently on pace for 3,107 successful stolen bases. That would be the most since 2012 (3,229) and up from 2,486 last year. Again, it's early, but there has been a definite uptick in steals so far this season.
Six days into the new season, MLB's rule changes are working as intended. The pace of play is greatly improved thanks to the pitch timer, there are more hits thanks in some part to the limit on extreme shifts, and there are more stolen bases too. There's more stuff going on and less waiting around for that stuff to happen. I have found it all very refreshing.
![[object Object] Logo](https://sportshub.cbsistatic.com/i/2020/04/22/e9ceb731-8b3f-4c60-98fe-090ab66a2997/screen-shot-2020-04-22-at-11-04-56-am.png)


