


Next Game
Now Playing
Share Video
Link copied!
-
 1:38
1:38BREAKING: Rockets, Dorian Finney-Smith agree to four-year, $53 million deal
-
 1:12
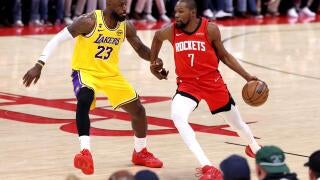
1:12First Round Game 1 Highlights: Rockets at Lakers
-
 1:54
1:54Breaking Down the Hawks vs. Knicks Playoff Matchup
-
 1:43
1:43How to Play Lakers-Rockets Series
-
 1:07
1:07Doncic, Cunningham Eligible For NBA Awards
-
 0:47
0:47Highlights: Knicks at Rockets (3/31)
-
 1:07
1:07Highlights: Heat at Rockets (3/21)
-
 1:21
1:21NBA Lookahead Bets: Rockets at Hornets
-
 1:01
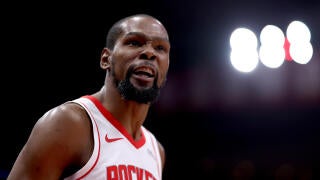
1:01Kevin Durant Downplays Concerns About How Hard Team Will Play
-
 1:45
1:45Contenders That Need To Make a Move
-
 9:34
9:34Giannis Antetokounmpo Potential Landing Spots
-
 1:16
1:16Concern Level For Lakers After Christmas Loss To Rockets
-
 1:35
1:35Durant, Rockets Take On LeBron & Lakers
-
 5:29
5:29Kevin Durant vs. LeBron James On Christmas Day
-
 0:55
0:55MUST SEE: Wild Finishes In Hoops
-
 4:21
4:21Ime Udoka Fires Off On Officials After Loss To Nuggets
-
 0:50
0:50Expert Pick: Rockets at Spurs
-
 0:46
0:46Highlights: Nets at Rockets (10/27)
-
 1:13
1:13Ashley Nicole Moss Discusses Kevin Durant Dropping 29 Points In His Rockets Debut
-
 1:09
1:09NBA Opening Night: Rockets at Thunder
This page may contain affiliate links. If you click and sign up, make a deposit, or place a wager, we may earn a commission at no additional cost to you.
2025 Stats
| STATS |
MPG
Minutes Per Game
|
PPG
Points Per Game
|
FG%
Field Goal Percentage
|
RPG
Rebounds Per Game
|
APG
Assists Per Game
|
|---|---|---|---|---|---|
| Regular Season | 16.8 | 3.3 | 33.3 | 2.5 | 1.0 |
Top Dorian Finney-Smith News

-
Rockets' Dorian Finney-Smith: Exits rotation Friday
Finney-Smith (coach's decision) went unused off the bench Friday in the Rockets' 119-109 win over the Grizzlies.
Since completing his recovery from offseason left ankle surgery and making his Rockets debut Dec. 25, Finney-Smith has failed to rediscover his shooting touch. The 10th-year forward has converted at a lowly 31.7 percent rate from the field and 26.9 percent from three-point range over his 35 appearances, and his continued shooting struggles appear to have resulted in him falling out of the rotation. Head coach Ime Udoka turned to Tari Eason and Jae'Sean Tate to play reserve minutes at forward Friday while Finney-Smith and Josh Okogie were both phased out.
... See More ... See Less -
Rockets' Dorian Finney-Smith: Fails to score Monday
Finney-Smith recorded zero points (0-1 FG, 0-1 3Pt) and two rebounds across eight minutes during Monday's 132-124 loss to Chicago.
Finney-Smith continues to offer very little in terms of tangible production, having scored no more than five points in 11 of his past 13 appearances. While he does provide Houston with a solid veteran presence, his ability to have an impact on the court is not what it once was. In 34 games this season, he has averaged just 3.1 points in 17.2 minutes.
... See More ... See Less -

-
Rockets' Dorian Finney-Smith: Starting Friday
Finney-Smith will start Friday versus the Pelicans, Will Guillory of The Athletic reports.
This will be the first start of the season for Finney-Smith, who will be joined in the first unit by Amen Thompson, Tari Eason, Kevin Durant and Jabari Smith. Per 36 minutes this season, Finney-Smith owns averages of 6.8 points, 5.5 rebounds, 1.8 assists and 1.6 triples per contest.
... See More ... See Less -
Rockets' Dorian Finney-Smith: Will play vs. Pelicans
Finney-Smith (ankle) isn't listed on the injury report ahead of Friday's game against New Orleans.
Finney-Smith sat out of Wednesday's clash for injury management purposes, but he'll be back in action Friday evening. The Florida product is averaging 4.0 points, 3.2 rebounds and 1.5 assists over his last six appearances, all as a reserve.
... See More ... See Less -
Rockets' Dorian Finney-Smith: Sitting out Wednesday
Finney-Smith is out for Wednesday's game against Denver due to left ankle injury management.
Finney-Smith has yet to play both ends of a back-to-back set since making his season debut Dec. 25, so his absence Wednesday doesn't come as a major surprise after he suited up for Tuesday's 113-99 win over the Raptors. He played 21 minutes in the victory, finishing with three points (1-3 FG, 1-2 3Pt), three rebounds, two assists and one steal.
... See More ... See Less -
Rockets' Dorian Finney-Smith: Good to go Friday
Finney-Smith (ankle) is good to go for Friday's game against Portland.
Finney-Smith is no longer on the injury report after sitting out the front end of this back-to-back set. The forward is averaging 19.1 minutes over his last five appearances.
... See More ... See Less -
Rockets' Dorian Finney-Smith: Sitting out Thursday
Finney-Smith (ankle) won't play in Thursday's game against the Warriors, Lachard Binkley of SI.com reports.
The veteran forward is sitting out the front end of Houston's back-to-back for injury management, and the expectation is that Finney-Smith will be able to play in Friday's tilt versus Portland. His absence Thursday should lead to a bump in minutes for Josh Okogie and Clint Capela off the bench.
... See More ... See Less -
Rockets' Dorian Finney-Smith: Decent workload in win
Finney-Smith ended with five points (2-6 FG, 1-1 3Pt), six rebounds, one assist and one steal across 27 minutes during Monday's 123-118 win over the Wizards.
Finney-Smith saw a sizable workload in this win, but he wasn't able to do much damage in the box score. Amen Thompson suffered an ankle issue Monday and Jabari Smith (ankle) is also day-to-day, so Finney-Smith could see a short-term boost in minutes.
... See More ... See Less -
Rockets' Dorian Finney-Smith: Off injury report
Finney-Smith (knee) is off the injury report for Thursday's game against the Magic.
The veteran forward sat out Wednesday's blowout win over the Kings due to knee injury management. Finney-Smith is ready to handle his typical role off the bench Thursday, but he hasn't yet reached double figures in scoring in any of his 23 appearances.
... See More ... See Less -
Rockets' Dorian Finney-Smith: Ruled out for Wednesday
Finney-Smith (knee) won't play Wednesday against the Kings, Lachard Binkley of SI.com reports.
Finney-Smith will receive a rest day on the first leg of this back-to-back set, but he'll return to the floor for Thursday's game in Orlando. Josh Okogie could see some extra minutes with Finney-Smith unavailable, and Jeff Green might be able to get into the rotation.
... See More ... See Less -
Rockets' Dorian Finney-Smith: Fares well in win
Finney-Smith (knee) finished Thursday's 105-101 win over the Hornets with eight points (3-7 FG, 2-6 3Pt), four rebounds, one assist and one steal across 23 minutes.
Houston's final game prior to the All-Star break was the second half of a back-to-back, and Finney-Smith sat out that contest for injury maintenance. He was good to go for the first game coming out of the break, and Finney-Smith ended up receiving his largest workload of the season in narrow win. The Rockets are thin in the frontcourt in the wake of Steven Adams' season-ending ankle injury, so Finney-Smith could end up maintaining a 20-plus-minute role moving forward if his play warrants the extra playing time.
... See More ... See Less -
Rockets' Dorian Finney-Smith: Off injury report
Finney-Smith (knee) is off the injury report for Thursday's game against the Hornets.
Houston's final contest prior to the All-Star break was the second half of a back-to-back, which Finney-Smith sat out, but he's good to go for Thursday and should occupy his usual role off the bench. However, the veteran forward has failed to score at least five points in each of his last seven appearances, diminishing most of his fantasy appeal.
... See More ... See Less -
Rockets' Dorian Finney-Smith: Resting Wednesday
Finney-Smith (knee) has been ruled out for Wednesday's game against the Clippers.
As expected, Finney-Smith will be held out for the second leg of the back-to-back set due to left ankle injury management. Finney-Smith played a season-high 20 minutes in Tuesday's 102-95 win over the Clippers, finishing with three points (1-2 FG, 1-2 3Pt), two assists, one rebound and one block.
... See More ... See Less -
Rockets' Dorian Finney-Smith: Limited again in victory
Finney-Smith produced three points (1-2 FG, 1-2 3Pt), one rebound, two assists and one block in 20 minutes during Tuesday's 102-95 victory over the Clippers.
Finney-Smith scored fewer than five points for the seventh straight game, despite the fact that he has carved out a somewhat consistent role. In 12 appearances over the past month, he has averaged just 3.1 points in 16.1 minutes, leaving him well and truly off the fantasy radar.
... See More ... See Less -
Rockets' Dorian Finney-Smith: Available to play Thursday
Finney-Smith (ankle) is available for Thursday's game against the Hornets.
After sitting out the front end of a back-to-back set, Finney-Smith will be good to go for this contest. The forward is averaging 15.5 minutes per game over his last five outings.
... See More ... See Less -
Rockets' Dorian Finney-Smith: Sitting out Wednesday
Finney-Smith is out for Wednesday's game against the Celtics due to left ankle injury management.
The expectation is that the veteran forward will be ready to go for Thursday's tilt against the Hornets. Josh Okogie and Clint Capela should help fill out the frontcourt minutes Wednesday.
... See More ... See Less -
-
Rockets' Dorian Finney-Smith: Fades injury report
Finney-Smith (ankle) is not listed on the injury report ahead of Saturday's game against the Mavericks.
The Rockets held Finney-Smith out of the second leg of their back-to-back set Thursday against the Hawks due to left ankle injury management, but the veteran forward will be available for Saturday's Texas clash. Finney-Smith is averaging 2.9 points and 2.6 rebounds over 15.7 minutes per game this season.
... See More ... See Less -
Rockets' Dorian Finney-Smith: Resting Thursday
Rockets head coach Ime Udoka said that Finney-Smith will be out for Thursday's game in Atlanta due to left ankle injury management, Varun Shankar of the Houston Chronicle reports.
Houston will exercise caution in holding out Finney-Smith and Tari Eason for the second leg of a back-to-back set after both played in Wednesday's game against the Spurs. In the Rockets' 111-99 loss, Finney-Smith finished with zero points (0-2 FG, 0-2 3Pt) and two rebounds in 19 minutes. Finney-Smith is averaging just 2.9 points and is shooting 30 percent from the field over 15 appearances with Houston since being cleared to make his season debut Dec. 25 upon completing his recovery from offseason ankle surgery.
... See More ... See Less
Player Bio
| HT/WT: 6-7, 220 lbs |
| Birthplace: Portsmouth, VA |
| Age: 32 |
| School: Florida |
| Experience: 9 |