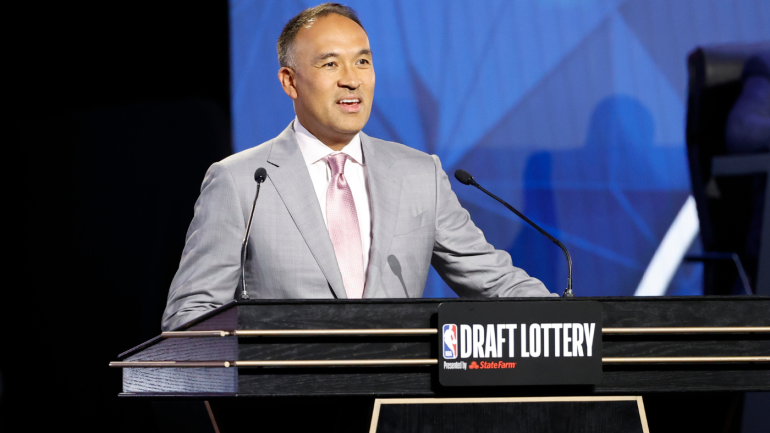
The NBA draft lottery embodies a fundamental truth about sports that nobody wants to admit: success or failure often boils down to luck. Despite the thousands of hours of manpower and the millions of dollars spent on scouting and planning, a team's draft fate is reduced to a couple of ping pong balls in a lottery machine. There is no pretense of competitiveness. There is nothing a team can do, short of losing, to increase their odds. They can only await the random judgment of the ambivalent basketball gods.
This has been how the NBA has awarded its best prospects to teams for nearly four decades. The 1984 season featured some of the most brazen tanking in league history as teams jockeyed for position ahead of a draft class featuring Hakeem Olajuwon, Michael Jordan and Charles Barkley. In response, the NBA introduced a flat lottery system to discourage intentional losing: all seven non-playoff teams had identical 14.29% chances at all seven lottery selections. The structure has changed quite a bit since then, both helping and hurting the worst teams in the league at various points in history. But the general principle has remained in place since 1985: once the season ends, a team's draft position comes down to luck.
On Tuesday, the Detroit Pistons, Houston Rockets and San Antonio Spurs will each have a 14% chance to select Victor Wembanyama. Those are the second-lowest odds the worst teams have ever had on lottery night, and the worst since 1989, when all nine teams involved had 11.1% shots at the top slot. The stakes in 1989 were pretty minimal. The No. 1 pick was Pervis Ellison and no lottery selections have yet been inducted into the Hall of Fame. The stakes on Tuesday are massive. Wembanyama is widely considered to be the best prospect to enter the NBA since LeBron James 20 years ago, and his first NBA home will come down to nothing more than blind luck.
So let's lean into that concept a bit and try to figure out who is in the best shape on Tuesday night. The NBA has now held 38 lotteries since 1985. Who has been the luckiest team in the overall history of the lottery? Who has been the unluckiest? We dug through all four decades of lottery history to come up with an empirical answer, but before we reveal it, we need to establish some ground rules:
- We are treating luck as a quantifiable entity. The purpose of this exercise is to determine how many net draft slots each team has gained or lost relative to where its record would have had them draft in a system without a lottery.
- Luck is not relative. Moving up to No. 1 in the year James is available means the same as doing so when Ellison is available. Earning a No. 1 overall pick, in itself, is not "luck." What matters is the movement relative to the slot the team would have drafted in if the order was based strictly on record.
- A pick is counted toward a team's total if it controlled that pick on lottery night. Only the final outcome matters, so a team will not gain extra points for keeping a partially protected pick or lose points for sending out a partially protected pick. Only the pick's placement relative to its original slot counts, and only the final owner on lottery night gets credit. While luck involving protections certainly exists, it is not easy to universally quantify because the protections on each pick and the odds of keeping or surrendering it are unique to that selection.
- The Seattle Supersonics and Oklahoma City Thunder will be treated as separate entities, with 2007 serving as the cutoff because, despite Kevin Durant starting his career in Seattle, it was Oklahoma City that primarily benefitted from his presence. Charlotte picks prior to 2002 will count for the Hornets despite that franchise technically moving to New Orleans and becoming the Pelicans at that point. All Grizzlies picks, however, will count towards Memphis because they were in Vancouver for such a short time that the implications of any lottery they participated in before moving ultimately affected them upon arrival in Memphis.
- Lottery results were taken from RealGM's indispensable lottery tool. Trades were mined from Basketball-Reference's transactions page. The raw data used to construct the tables below can be found on this spreadsheet.
So, with all of this in mind, who are the luckiest teams in lottery history? For this exercise, we will track luck in three different categories.
Who had the greatest net gain/loss?
Our first category is the most basic, and probably the most informative. All 30 current NBA teams plus the Sonics are ranked below by how many net draft slots they've gained or lost since 1985 relative to a draft system based entirely on record.
| Team | Net Gain/Loss |
|---|---|
+24 | |
Charlotte Hornets | +14 |
+9 | |
+6 | |
San Antonio Spurs | +6 |
New Orleans Pelicans | +6 |
Seattle Supersonics | +6 |
+3 | |
+3 | |
+3 | |
+3 | |
Oklahoma City Thunder | +2 |
+1 | |
+1 | |
+1 | |
+1 | |
Houston Rockets | +1 |
0 | |
Memphis Grizzlies | 0 |
-2 | |
Detroit Pistons | -2 |
-3 | |
-3 | |
-5 | |
-7 | |
-10 | |
-10 | |
-10 | |
-11 | |
-12 | |
-15 |
By this measure, we have an obvious answer to the question of "who is the luckiest team in lottery history." The Philadelphia 76ers have gained 24 slots thanks to the lottery. That's 10 more than any other team, but the 76ers haven't always put their luck to the best use. While jumping up to No. 1 in 1996 landed them Allen Iverson, they actually moved down in 2014 when they picked Joel Embiid. Several of their major jumps led to outright busts (Evan Turner, Roy Hinson in a trade for their No. 1 overall pick in 1986) or poorly conceived trades (Markelle Fultz). The bottom line is that the lottery gods have given the 76ers plenty of chances at top talent. They just haven't made the most of it.
The Hornets have done a better job with their opportunities. Every single one of their jumps up the board led to an All-Star: Larry Johnson in 1991, Alonzo Mourning in 1992, Baron Davis in 1999 and LaMelo Ball in 2020. The problem has been Charlotte's over-reliance on that luck. That quartet represents just under 43% of all Charlotte All-Star selections. The Hornets never successfully put teams around their lottery prizes. The Lakers sit on the other end of the spectrum. Practically their entire net gain of nine slots came down to a seven-pick jump in 2019, and they used the No. 4 overall pick it got them to trade for Anthony Davis. The Lakers already had the tools to capably surround Davis, they just needed a bit of help from the lottery gods to get him.
At the bottom of this list we have six teams that reached double-digit net losses. As you've likely noticed, some of the most successful teams of the past 40 years are in that group. Golden State, Miami and Dallas have won eight championships since the lottery was introduced, and all three of them (Stephen Curry for Golden State, Dwyane Wade for Miami and Dirk Nowitzki for Dallas) did so with players they landed in the lottery. They just didn't have to move up to get those players. This is the ultimate lesson of this exercise. Moving up can be helpful, but fortune favors the prepared. The 76ers had all of the luck in the world and they couldn't beat out the superior scouting and management of the Warriors, Heat and Mavericks.
Now, you're probably wondering about some of the teams that are stereotypically considered "lucky" by lottery standards. The Magic and Cavaliers, for instance, have each made four No. 1 overall picks during the lottery era, yet neither cracks the top three here. To some extent, that can be explained simply: most of the time, those teams were already quite bad when they leapt up to the top of the draft. They therefore didn't have far to go, and their net gains were either meager or nonexistent. However, there is another factor that we need to consider here: volume.
Who has moved up or down the most often?
Here's where things get a bit more interesting. We no longer care how much a team jumps or how far it falls. We're only going to track quantity: how many times has a team's draft position improved and how many times has it gotten worse?
| Team | Upward movements | Downward Movements | Net movement |
|---|---|---|---|
Philadelphia 76ers | 8 | 1 | +7 |
San Antonio Spurs | 3 | 0 | +3 |
Los Angeles Lakers | 3 | 1 | +2 |
Oklahoma City Thunder | 3 | 2 | +1 |
New Orleans Pelicans | 2 | 2 | 0 |
Seattle Supersonics | 2 | 2 | 0 |
Portland Trail Blazers | 2 | 2 | 0 |
Brooklyn Nets | 2 | 3 | -1 |
Utah Jazz | 1 | 2 | -1 |
Houston Rockets | 1 | 2 | -1 |
Los Angeles Clippers | 6 | 8 | -2 |
Toronto Raptors | 3 | 5 | -2 |
Indiana Pacers | 1 | 3 | -2 |
Boston Celtics | 1 | 3 | -2 |
Atlanta Hawks | 4 | 6 | -2 |
Charlotte Hornets | 4 | 7 | -3 |
Milwaukee Bucks | 2 | 5 | -3 |
Detroit Pistons | 2 | 5 | -3 |
Phoenix Suns | 2 | 5 | -3 |
Cleveland Cavaliers | 4 | 8 | -4 |
Orlando Magic | 3 | 7 | -4 |
Chicago Bulls | 3 | 7 | -4 |
Memphis Grizzlies | 4 | 8 | -4 |
Washington Wizards | 3 | 9 | -6 |
Golden State Warriors | 3 | 9 | -6 |
Dallas Mavericks | 0 | 6 | -6 |
New York Knicks | 1 | 8 | -7 |
Denver Nuggets | 0 | 7 | -7 |
Miami Heat | 0 | 7 | -7 |
Sacramento Kings | 3 | 11 | -8 |
Minnesota Timberwolves | 1 | 11 | -10 |
Once again, we kick things off with the 76ers, who amazingly manage to lead the NBA in upward movements (eight) while being one of just three teams to move down one or fewer times. The 76ers somehow managed to jump in six of their first eight lottery appearances. They are, empirically, the luckiest team in lottery history.
Here's where we start to diverge. The No. 2 slot in our last category went to the Hornets. Here? They're toward the bottom. That's because Charlotte's lottery history is essentially all or nothing. They have four jumps in franchise history, but those four jumps were for four, five, six and 10 slots. Charlotte either rises significantly or falls. There's rarely much in between. So our new No. 2 is San Antonio. The Spurs are the only team in lottery history never to move down. They've moved up three times and done well with all three picks: David Robinson, Sean Elliott and Tim Duncan.
Now we can circle back to the Magic and Cavaliers. Yes, they've frequently found themselves in the No. 1 position. However, whenever they don't land at No. 1, they tend to fall. That is what happens in the lottery over a sustained sample size. Orlando and Cleveland have spent so much time in the lottery that they are dragged down by years of losing one or two slots of ground. They've combined to go backward 15 times. This is where your personal definitions of luck will come into play. Cleveland jumped up to get Kyrie Irving and Evan Mobley. Orlando's improvements netted Shaquille O'Neal, Penny Hardaway and Paolo Banchero.
Those players are so good that most teams would gladly accept several years in which their picks lost value on lottery night. From that perspective, the Magic and Cavaliers were still quite lucky. It just didn't quite manifest in the ways that we are quantifying here. Ultimately, a single player at the top of the lottery can be so transformative that all subsequent lottery losses hardly matter.
The New York Knicks put that theory to the test. They famously leapt up to No. 1 in the very first lottery. The victory was so lucky that many still question the event's legitimacy. But look at what happened afterward. The Knicks jumped once and haven't done so since. Was Patrick Ewing worth four decades of lottery futility? Maybe? He held up his end of the bargain on the court, but the Knicks could never give him the support he needed to get over the championship hump.
Once again, the teams at the bottom of this list have proven fairly successful. Miami, Dallas and Denver are the three teams never to improve their pick through the lottery. We've covered Miami and Dallas already. Denver might win its first championship this season thanks to a No. 41 overall selection. All three teams have been unlucky, but none of them have really needed luck. On the rare occasions in which they've been bad, they've found other ways to replenish their rosters.
That sadly isn't true of Minnesota, as the Timberwolves once again fall to the bottom of our list. They didn't improve their pick through the lottery until 2020, and Anthony Edwards was well worth the wait. But otherwise? They lost pick value in the lottery on 11 separate occasions.
Who has had the best and worst luck on average?
Now it's time for us to combine both categories. Below is an average of how much pick value teams have gained or loss per lottery appearance.
| Team | Net Gain/Loss | Lottery Appearances | Average Gain/Loss Per Lottery Appearance |
|---|---|---|---|
Los Angeles Lakers | +9 | 7 | +1.28 |
Philadelphia 76ers | +24 | 19 | +1.26 |
San Antonio Spurs | +6 | 6 | +1 |
Seattle Supersonics | +6 | 9 | +0.67 |
Charlotte Hornets | +14 | 23 | +0.61 |
New Orleans Pelicans | 6 | 13 | +0.46 |
Oklahoma City Thunder | +3 | 8 | +0.38 |
Portland Trail Blazers | +3 | 8 | +0.38 |
Cleveland Cavaliers | +6 | 21 | +0.29 |
Brooklyn Nets | +3 | 12 | +0.25 |
Orlando Magic | +3 | 22 | +0.14 |
Los Angeles Clippers | +3 | 25 | +0.12 |
Utah Jazz | +1 | 10 | +0.1 |
Houston Rockets | +1 | 10 | +0.1 |
Indiana Pacers | +1 | 10 | +0.1 |
Chicago Bulls | +1 | 15 | +0.07 |
Toronto Raptors | +1 | 16 | +0.06 |
Milwaukee Bucks | 0 | 17 | 0 |
Memphis Grizzlies | 0 | 12 | 0 |
Boston Celtics | -2 | 16 | -0.13 |
Detroit Pistons | -2 | 14 | -0.14 |
Phoenix Suns | -3 | 17 | -0.18 |
Sacramento Kings | -5 | 27 | -0.19 |
Atlanta Hawks | -3 | 14 | -0.21 |
Washington Wizards | -7 | 19 | -0.37 |
Golden State Warriors | -10 | 23 | -0.44 |
New York Knicks | -10 | 15 | -0.67 |
Minnesota Timberwolves | -15 | 21 | -0.71 |
Denver Nuggets | -10 | 14 | -0.71 |
Dallas Mavericks | -12 | 14 | -0.86 |
Miami Heat | -11 | 12 | -0.92 |
Finally, a category not won by the 76ers! Of course, that's mostly due to a single-year quirk. The Lakers are practically never in the lottery. As we mentioned, their net gain is due almost entirely to their seven-pick jump in 2019. Considering their seven meager lottery appearances, their average bolts to the top of the leaderboard. Philadelphia comes in a close second place. Only the Lakers, Sixers and Spurs can claim to have gained an average of one pick per lottery appearance.
We also have a bit of a shakeup at the bottom of the list. Minnesota was by far the unluckiest team in our first two categories, but the Timberwolves are in the lottery so often that their average gets dragged down by their one successful jump in 2020. The Mavericks and Heat have never jumped, and they're hardly ever in the lottery, so it makes sense that they would occupy the two bottom spots here.
Ultimately, though, there are very few teams who have vastly over or underperformed their expectation in the aggregate thanks to the lottery. Two thirds of the league is within half of a pick of their expectation on average, and only the Lakers and 76ers are more than one full pick away from their expectation. Over time, we shouldn't expect the lottery to reward certain teams more than others. That it does so in specific, random seasons is part of the fun of this entire exercise. NBA teams don't tend to think in terms of 40- or 50-year samples. The right outcome on one lottery night can change the entire trajectory of their franchise, and that is something that these numbers just can't capture.
Conclusion
The data itself makes it clear who the luckiest and unluckiest teams in lottery history are. Generally speaking, the 76ers, Hornets, Lakers and Spurs are at the top of the list while the Heat, Mavericks, Knicks, Nuggets and Timberwolves are at the bottom. Most teams lie somewhere in between. Where exactly you'd rank any individual team would depend on your methodology, and of course, we didn't cover protected picks extensively in this study. That could change the equation significantly. The Lakers, for instance, kept a very lightly protected pick in three consecutive lotteries from 2015-2017 by landing at No. 2 in all three drafts. That is a definite form of luck, but it is one we couldn't uniformly quantify. If you wanted to give the Lakers a bit of a bump on that front, no one would blame you.
But there are a few other macro conclusions we can draw from these numbers that don't relate to individual teams. The biggest is that, to the chagrin of the conspiracy theorists, there doesn't appear to be any sort of big-market bias at play here. Yes, the Lakers are at the top of this list, but they've benefitted less from the lottery than the Hornets have. The Spurs, Cavaliers, Pelicans and Sonics have been major lottery beneficiaries. The Warriors, Knicks and Heat obviously haven't been. Whenever a big-market team wins the lottery, fans cry foul and claim it was rigged. But remember... there are 30 teams and there have been 38 lotteries. Mathematically speaking, every team should have expected to win the lottery at least once by now. The Knicks and Lakers were bound to have positive outcomes by now due to the law of averages alone. In the aggregate, even though they sit on opposite ends of the spectrum, both are within boundaries set by other teams.
And finally, it bears repeating that correlation between overall lottery luck and on-court success over the past four decades is fairly minimal. Yes, there are specific examples of teams like the Spurs using a few lucky lotteries as launching pads into years of contention, but there are far more examples of teams like the Pelicans, Hornets and Sonics who outperformed expectations in the lottery and couldn't translate those results into wins on the court.
It would be naive of us to assume that there is no link here whatsoever. In the right draft, a jump can swing a decade of a team's history. But we can't blindly say that lottery luck correlates to sustainable winning because so many things go into building a sustainable winner that most of the time, a single bit of lottery luck is just going to be a drop in the bucket. It can change things for a few years, and it can even lead to championships, but as the 76ers have proven, it takes far more than luck to win in the NBA.
![[object Object] Logo](https://sportshub.cbsistatic.com/i/2020/04/22/e9ceb731-8b3f-4c60-98fe-090ab66a2997/screen-shot-2020-04-22-at-11-04-56-am.png)


