This page may contain affiliate links. If you click and sign up, make a deposit, or place a wager, we may earn a commission at no additional cost to you.
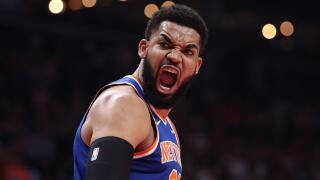
Knicks' Karl-Anthony Towns: Another double-double Tuesday
Rotowire
Towns registered 16 points (5-7 FG, 1-3 3Pt, 5-6 FT), 14 rebounds, six assists, two blocks and two steals over 34 minutes during Tuesday's 126-97 victory over the Hawks in Game 5 of the first round of the Eastern Conference playoffs.
Towns continues to play arguably his best basketball of the season, recording his third straight double-double while adding four combined steals and blocks for the second time in his past three appearances. Across five playoff appearances, Towns has put up 20.0 points, 11.4 rebounds, 5.2 assists, 1.6 three-pointers and 3.2 combined steals and blocks. Now leading 3-2, New York will head to Atlanta for Game 6, where it will look to wrap up the series.
... See More... See Less
Knicks' Karl-Anthony Towns: Triple-doubles in Game 4 win
Rotowire
Towns registered 20 points (6-10 FG, 1-2 3Pt, 7-9 FT), 10 rebounds, 10 assists and two steals in 29 minutes during Saturday's 114-98 win over the Hawks in Game 4 of the first round of the Eastern Conference playoffs.
Towns notched the first postseason triple-double of his career and finished with a plus-16 differential in the 16-point win. He played a pivotal role in helping the Knicks even up their first-round series with the Hawks, and now they'll head back to New York for Game 5 on Tuesday.
Knicks' Karl-Anthony Towns: Secures double-double in loss
Rotowire
Towns provided 21 points (7-12 FG, 1-3 3Pt, 6-6 FT), 17 rebounds, four assists, two blocks and two steals over 34 minutes during Thursday's 109-108 loss to Atlanta in Game 3 of the first round of the Eastern Conference playoffs.
Towns didn't post an eye-popping night offensively, but he crashed the glass for his first double-double of the series. He also made an impact across the board by tallying a pair of blocks and steals. The Knicks received 20-plus points from Towns, Jalen Brunson and OG Anunoby, but it wasn't quite enough to bring home the victory.
Knicks' Karl-Anthony Towns: Productive in Game 1 victory
Rotowire
Towns accumulated 25 points (6-13 FG, 3-4 3Pt, 10-10 FT), eight rebounds, four assists, three blocks and one steal over 33 minutes during Saturday's 113-102 win over the Hawks in Game 1 of the first round of the Eastern Conference playoffs.
Towns was held scoreless in the first quarter but came alive in the second half with 19 points, 11 of which came in the fourth frame. Much of that scoring production came courtesy of the free-throw line, though he was also efficient from three-point range on limited attempts, and he finished as the Knicks' second-leading scorer behind Jalen Brunson (28 points). Towns' shooting splits noticeably dipped this season compared to 2024-25, but the veteran big man still has the capability of having a big performance on any given night, which will be crucial for New York's postseason run.
Towns (elbow) is available for Game 1 against the Hawks on Saturday.
The Knicks rested multiple players in the regular-season finale, but Towns' status for Game 1 was never in any doubt. The Knicks have a completely healthy roster ahead of this matchup.
Knicks' Karl-Anthony Towns: Won't play against Charlotte
Rotowire
Towns has been ruled out for Sunday's regular-season finale against the Hornets due to right elbow injury management.
The Knicks don't have anything to play for Sunday, given that they were locked in as the No. 3 seed in the Eastern Conference following the Celtics' blowout win over the Pelicans on Friday. As such, Towns and the rest of the New York starters will be rested for the Knicks' regular-season finale, though they should all be available for the start of the postseason, with the possible exception of OG Anunoby (ankle). Towns will end the 2025-26 regular season averaging 20.1 points, 11.9 rebounds, 3.0 assists, 1.5 threes and 0.9 steals over 31.0 minutes per game. With Towns and Mitchell Robinson (ankle) both out, the Knicks will lean more heavily on Ariel Hukporti, Trey Jemison, Mohamed Diawara and Jeremy Sochan.
... See More... See Less
Knicks' Karl-Anthony Towns: Logs another double-double
Rotowire
Towns logged 22 points (8-12 FG, 1-3 3Pt, 5-5 FT), 10 rebounds and five assists over 30 minutes in Friday's 112-95 win over Toronto on Friday.
Towns scored 14 of his 22 points in the first half to help the Knicks build a 15-point lead heading into the break. He finished as the team's leader in rebounds and assists and second in points behind Jalen Brunson (29 points). Towns has recorded a double-double in three consecutive games and is up to 56 on the season, which leads the Association. New York is locked in as the No. 3 seed in the Eastern Conference, so it wouldn't be surprising to see Towns rest for Sunday's regular-season finale against Charlotte.
... See More... See Less
Knicks' Karl-Anthony Towns: Double-doubles in win
Rotowire
Towns tallied 16 points (6-12 FG, 1-4 3Pt, 3-3 FT), 12 rebounds, four assists and two steals across 30 minutes in Thursday's 112-106 win over the Celtics.
Towns didn't deliver his most efficient shooting performance from beyond the arc but still finished as New York's third-leading scorer behind Josh Hart (26) and Jalen Brunson (25). Towns turned in a solid all-around outing, grabbing a team-high 12 rebounds and recording multiple steals for a second straight game. The star big man also notched his third straight appearance with a double-double or better and has logged four such performances over his last five games, during which he has averaged 18.8 points, 12.2 rebounds, 5.2 assists and 1.0 steals per contest.
Knicks' Karl-Anthony Towns: Not listed on injury report
Rotowire
Towns (elbow) has been removed from the injury report ahead of Monday's game in Atlanta.
Towns will return from a one-game absence Monday, which will likely shift Mitchell Robinson back to the second unit, and there will be fewer minutes available for Mohamed Diawara and Ariel Hukporti. Towns is averaging 20.1 points, 11.9 rebounds, 2.9 assists, 1.5 triples and 1.3 stocks per game this season.
... See More... See Less
Knicks' Karl-Anthony Towns: Takes part in practice
Rotowire
Towns (elbow) participated in practice Sunday, Jared Schwartz of the New York Post reports.
Towns was held out of Friday's game against Chicago after suffering a right elbow injury, but it appears he's trending in the right direction after practicing Sunday morning. The team should have an official designation for the big man closer to Monday's game in Atlanta.
... See More... See Less
Knicks' Karl-Anthony Towns: Ruled out for Friday
Rotowire
Towns (elbow) won't play Friday versus the Bulls, James L. Edwards III of The Athletic reports.
Towns only took a few shots at shootaround before grabbing at his elbow and retreating back to the locker room, so it's not surprising to see him get ruled out for Friday's game. Mitchell Robinson will draw the start in his absence, and for now, Towns should be viewed as questionable for Monday's game in Atlanta.


 1:56
1:56 0:59
0:59 1:04
1:04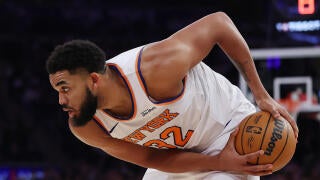 1:16
1:16 8:46
8:46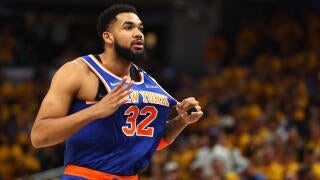 1:54
1:54 1:30
1:30 2:18
2:18 1:22
1:22 1:19
1:19 0:57
0:57 1:06
1:06 2:14
2:14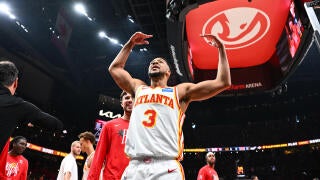 2:30
2:30 6:41
6:41 1:25
1:25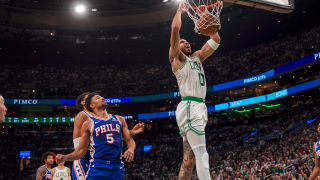 1:54
1:54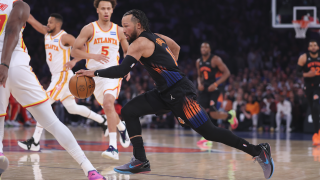 1:58
1:58 1:58
1:58