


Next Game
Now Playing
Share Video
Link copied!
-
 0:30
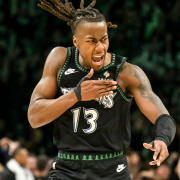
0:30BREAKING: Nickeil Alexander-Walker Wins NBA Most Improved Player
-
 1:03
1:03Highlights: Atlanta Hawks at Cleveland Cavaliers
-
 1:56
1:56NBA Eastern Conference: Hawks Make Splash With Nickeil Alexander-Walker Signing
-
 1:08
1:08Top Available NBA Free Agents: Nickeil Alexander-Walker (Unrestricted)
-
 1:22
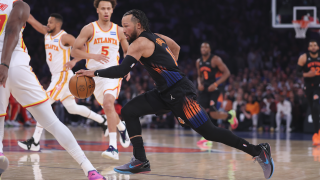
1:22First Round Game 4 Highlights: Knicks at Hawks
-
 1:06
1:06CJ McCollum Makes Hawks History in Win Over Knicks
-
 2:14
2:14What Happened On Knicks Last Possession?
-
 2:30
2:30Knicks In Six On Life Support For Ashley Nicole Moss
-
 1:25
1:25Pistons Even Series Up At Home Against Magic
-
 1:54
1:54Breaking Down Celtics' Game 1 Win Over 76ers
-
 1:58
1:58Knicks Suffer Historic 4th Quarter Collapse vs. Hawks
-
 1:58
1:58Hawks Rally From 12 Down In 4th Quarter To Even Series
-
 12:36
12:36Breaking Down the Top 5 NBA Finals Contenders
-
 1:54
1:54Breaking Down the Hawks vs. Knicks Playoff Matchup
-
 1:42
1:42How to Play Hawks-Knicks Series
-
 10:06
10:06Breaking Down the Giannis Antetokounmpo Trade Market
-
 1:57
1:57NBA Futures: Series Outcome Bet
-
 1:56
1:56NBA Futures: Series Moneyline Bet
-
 1:28
1:28NBA Futures: Lock This In Now
This page may contain affiliate links. If you click and sign up, make a deposit, or place a wager, we may earn a commission at no additional cost to you.
2025 Stats
| STATS |
MPG
Minutes Per Game
|
PPG
Points Per Game
|
FG%
Field Goal Percentage
|
RPG
Rebounds Per Game
|
APG
Assists Per Game
|
|---|---|---|---|---|---|
| Regular Season | 33.4 | 20.8 | 45.9 | 3.4 | 3.7 |
| Post Season | 37.5 | 13.8 | 34.6 | 3.3 | 2.8 |
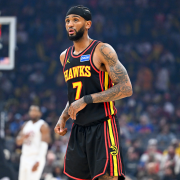
Top Nickeil Alexander-Walker News
-
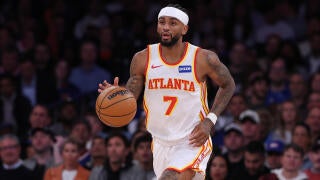
Hawks' Nickeil Alexander-Walker: Struggles offensively Monday
Alexander-Walker provided nine points (3-12 FG, 2-5 3Pt, 1-1 FT), five rebounds, six assists and three blocks in 38 minutes during Monday's 107-106 victory over the Knicks in Game 2 of the first round of the Eastern Conference playoffs.
Alexander-Walker struggled from the field for the second straight game, although he matched his season-high with three blocks. Despite a pair of underwhelming performances, Atlanta is positioned well, with the series tied 1-1 heading back to Atlanta. Given the season he has had, expect to see Alexander-Walker back on the front foot for Game 3 on Thursday.
... See More ... See Less -
-
Hawks' Nickeil Alexander-Walker: Cleared to play in postseason
Alexander-Walker (toe) isn't listed on the injury report for Saturday's Game 1 against the Knicks.
After sitting out the regular-season finale due to a right great toe sprain, Alexander-Walker has been cleared to play during the postseason. The veteran enjoyed a career year in his first regular season in Atlanta, averaging 20.8 points, 3.7 assists, 3.4 rebounds, 1.3 steals and 3.2 threes over 33.4 minutes per game.
... See More ... See Less -
-
Hawks' Nickeil Alexander-Walker: Won't play Sunday
Alexander-Walker (toe) has been ruled out for Sunday's regular-season finale against the Heat.
Alexander-Walker will end up missing the final game of the regular season while tending to a right great toe sprain, but that injury shouldn't prevent him from playing in the first round of the Eastern Conference playoffs. The veteran wing has enjoyed a career year in his first season in Atlanta, and he'll wrap up the 2025-26 regular season averaging 20.8 points, 3.7 assists, 3.4 rebounds, 1.3 steals and 3.2 threes over 33.4 minutes per game. The Hawks are resting several of their key players Sunday, which opens up more minutes for the likes of Corey Kispert, Zaccharie Risacher, Buddy Hield and Keaton Wallace.
... See More ... See Less -
Hawks' Nickeil Alexander-Walker: Nursing toe sprain
Alexander-Walker is listed as questionable for Sunday's game against the Heat due to a right great toe sprain.
Alexander-Walker may have picked up the injury during the Hawks' 124-102 win over the Cavaliers on Friday, when he played 32 minutes and finished with 18 points, one rebound, one assist, two steals, one block and three three-pointers. Corey Kispert, Zaccharie Risacher, Gabe Vincent and Jonathan Kuminga (knee) would all be in line for elevated roles in Alexander-Walker is unable to play in Sunday's regular-season finale.
... See More ... See Less -
Hawks' Nickeil Alexander-Walker: Team-high 25 points in loss
Alexander-Walker logged 25 points (10-19 FG, 4-9 3Pt, 1-1 FT), four rebounds, two assists and two steals over 39 minutes during the Hawks' 122-116 loss to the Cavaliers on Wednesday.
Alexander-Walker and Jonathan Kuminga (24 points) took on larger scoring roles during Wednesday's contest, which helped the Hawks stay in the game late despite the shooting struggles of Jalen Johnson and CJ McCollum. Alexander-Walker is in the midst of a career year and has been even better of late. Over his last 10 games, he has averaged 24.2 points, 3.8 assists, 3.5 rebounds, 3.8 threes and 1.4 steals over 34.9 minutes per game while connecting on 53.6 percent of his field-goal attempts.
... See More ... See Less -

-
Hawks' Nickeil Alexander-Walker: Pours in 32 points
Alexander-Walker produced 32 points (11-16 FG, 5-9 3Pt, 5-6 FT), four rebounds, one assist, one block and three steals across 33 minutes during Wednesday's 130-101 victory over the Magic.
For the fifth time this campaign, Alexander-Walker reached at least 32 points. He's had a tremendous season in Atlanta so far, posting averages of 20.6 points, 3.7 assists, 3.5 rebounds, 1.3 steals and 3.1 three-pointers on 45.3 percent shooting across 74 appearances.
... See More ... See Less -
Hawks' Nickeil Alexander-Walker: Strong performance Saturday
Alexander-Walker logged 27 points (7-14 FG, 4-9 3Pt, 9-9 FT), eight assists, five rebounds and four steals over 36 minutes during the Hawks' 123-113 win over the Kings on Saturday.
Alexander-Walker was held scoreless in the first quarter, but he came alive in the second with 14 points and ended up leading both teams in scoring. It was the 25th time this season that he connected on at least four three-pointers, and he also set a season high in steals, coming one swipe shy of matching a career best that he set in November of 2023. Alexander-Walker has 42 games this season in which he has scored 20-plus points, and it's no surprise to see him in the running for the NBA's Most Improved Player award given that he logged just 23 games of 20 or more points in six seasons prior to 2025-26. Since March 1, Alexander-Walker has averaged 23.1 points, 3.7 rebounds, 3.0 assists, 3.5 threes and 1.8 steals over 33.3 minutes per game.
... See More ... See Less -
Hawks' Nickeil Alexander-Walker: Scores 21 points in win
Alexander-Walker amassed 21 points (9-18 FG, 3-10 3Pt), four rebounds and three assists in 40 minutes during Wednesday's 130-129 overtime victory over the Pistons.
Alexander-Walker didn't miss a single shot through the first quarter of play, and he opened the game with six straight makes. He's been scorching over the past two, scoring a total of 47 points on 17-for-29 shooting. The Hawks have now won three in a row, and they'll look to keep that hot streak going Friday in Boston.
... See More ... See Less -
Hawks' Nickeil Alexander-Walker: Leads Hawks to victory
Alexander-Walker produced 26 points (8-11 FG, 4-6 3Pt, 6-6 FT), two rebounds, six assists and one steal in 26 minutes during Monday's 146-107 win over Memphis.
Alexander-Walker turned in a polished shooting performance and reached the 20-point threshold after being held to 17 points Saturday against the Warriors. He's put up 20 or more points in five of his last six showings, and he also dished out six assists for the second time in 11 March appearances.
... See More ... See Less -
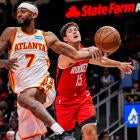
Hawks' Nickeil Alexander-Walker: Nets 21 points on 12 shots
Alexander-Walker had 21 points (6-12 FG, 1-3 3Pt, 8-9 FT), four rebounds, four assists and one steal across 27 minutes during Friday's 117-95 loss to the Rockets.
This marked Alexander-Walker's fourth straight 20-plus-point performance, and he's shot at least 50 percent from the field in all four games. He's been on a tear over that stretch, during which he has averaged 26.0 points, 3.8 rebounds, 3.0 assists, 4.3 triples and 2.0 steals per contest.
... See More ... See Less -
-
Hawks' Nickeil Alexander-Walker: Drains four treys in win
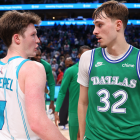
Alexander-Walker ended with 22 points (8-14 FG, 4-5 3Pt, 2-2 FT), one rebound, two assists, one block and two steals over 30 minutes during Wednesday's 135-120 victory over the Mavericks.
Alexander-Walker was unable to repeat the 41-point performance he delivered in the win over the Magic on Monday, but the talented guard continued his excellent season with another impressive performance. He's scored at least 20 points in three games in a row and six times over his last seven outings. He also drained multiple threes for the seventh straight game, showing his role in Atlanta's offensive scheme is enough reason to have him as a starter across all formats.
... See More ... See Less -
Hawks' Nickeil Alexander-Walker: Erupts for 41 points
Alexander-Walker tallied 41 points (12-22 FG, 9-15 3Pt, 8-9 FT), seven rebounds, five assists and two steals across 37 minutes in Monday's 124-112 win over the Magic.
Alexander-Walker torched the nets, posting a game-high and career-best 41 points to lift the Hawks to their 10th straight win. The 27-year-old was already off to a strong start in March, entering Monday's contest averaging 21.5 points while shooting 54.8 percent from the field and 44.4 percent from beyond the arc in six games this month. He's now eclipsed the 30-point mark in eight contests this season, with his previous best being 38 points. In what has been an up-and-down year in Atlanta that includes the trading of star Trae Young (quadriceps), Alexander-Walker has enjoyed a breakout first season with the team.
... See More ... See Less -
Hawks' Nickeil Alexander-Walker: Chips in 20 points
Alexander-Walker accumulated 20 points (7-14 FG, 3-7 3Pt, 3-3 FT), three rebounds, one assist, one block and three steals over 34 minutes during Saturday's 122-99 victory over the Bucks.
Alexander-Walker helped set the tone with 13 of his 20 points coming in the first half, and he finished as the Hawks' third-leading scorer behind CJ McCollum (30 points) and Jalen Johnson (23 points). Alexander-Walker also logged three steals for a second straight game, tying a season high that he's now set eight times. He has averaged 21.5 points, 3.0 assists, 2.2 rebounds, 3.3 threes and 1.8 steals over 33.9 minutes per game since March 1.
... See More ... See Less -
Hawks' Nickeil Alexander-Walker: Nets 18 points with three steals
Alexander-Walker posted 18 points (5-13 FG, 2-8 3Pt, 6-6 FT), two rebounds, two assists and three steals over 36 minutes during Thursday's 108-97 victory over Brooklyn.
While Alexander-Walker's shot wasn't falling Thursday, he did a nice job of getting to the line for easy buckets, and he was phenomenal on the defensive end. This marked his second straight game with at least two steals and his fourth consecutive outing with multiple triples. Alexander-Walker will look to keep the momentum rolling into Saturday's matchup with the Bucks.
... See More ... See Less -
Hawks' Nickeil Alexander-Walker: Another strong showing
Alexander-Walker accumulated 29 points (12-19 FG, 5-8 3Pt), two rebounds, three assists, one block and two steals over 37 minutes during Tuesday's 124-112 win over the Mavericks.
This was Alexander-Walker's eighth game of the campaign with at least 29 points, as he continues to have a career year in Atlanta. Across 62 appearances, he's averaging 20.0 points, 3.7 assists, 3.5 rebounds, 1.2 steals and 3.1 three-pointers in 33.2 minutes per contest.
... See More ... See Less -
Hawks' Nickeil Alexander-Walker: Scores 23 in easy win
Alexander-Walker closed with 23 points (9-14 FG, 5-9 3Pt), one rebound, two assists and one steal across 32 minutes during Wednesday's 131-113 victory over the Bucks.
Alexander-Walker surpassed the 20-point mark for the first time since Feb. 9, when he scored 23 points in a loss to the Timberwolves. He has scored in double digits in his last 32 games, so his consistency has been solid, and he's putting up 19.4 points, 3.4 rebounds and 4.1 assists per game over that stretch.
... See More ... See Less
Player Bio
| HT/WT: 6-5, 205 lbs |
| Birthplace: Toronto, CA |
| Age: 27 |
| School: Va. Tech |
| Experience: 6 |