


Now Playing
Share Video
Link copied!
-
 11:21
11:21What's Next For 2026 NFL Season?
-
 1:26
1:26What's Next For 2026 NFL Season: Aaron Rodgers Signs With Steelers
-
 1:57
1:572026 NFL Draft Grades: Indianapolis Colts
-
 0:29
0:292026 NFL Draft Grades: Colts Select Jalen Farmer No. 113
-
 0:26
0:262026 NFL Draft Grades: Ravens Select Elijah Sarrat No. 115
-
 0:47
0:472026 NFL Draft Grades: 49ers Select Kaelon Black No. 90
-
 0:40
0:402026 NFL Draft Grades: Colts Select A.J. Haulcy No. 78
-
 0:46
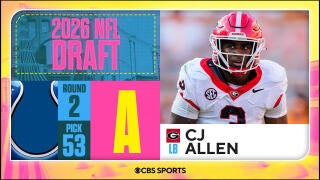
0:462026 NFL Draft Grades: Colts Select CJ Allen No. 53
-
 0:49
0:492026 NFL Draft Grades: Jets Select D'Angelo Ponds No. 50
-
 16:38
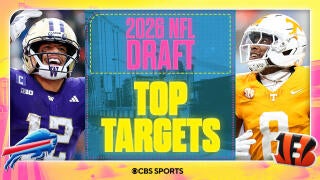
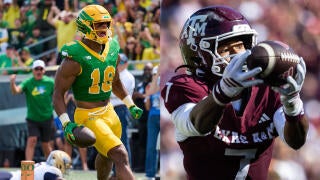
16:38Top Targets For Teams That Did Not Draft In Round 1
-
 1:02
1:02What's The Pressure Surrounding QB Fernando Mendoza Going #1 Overall?
-
 1:33
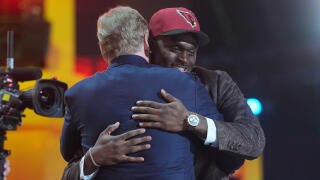
1:33Cardinals Select Notre Dame RB Jeremiyah Love No. 3 Overall
-
 1:36
1:36Biggest Takeaways From Day 1 Of 2026 NFL Draft
-
 2:25
2:25NFL Draft Really Begins For 8 Teams Today
-
 1:58
1:58Jets Trade Back Into First Round, Select Omar Cooper Jr.
-
 0:48
0:482026 NFL Draft Grades: Jets Select Omar Cooper Jr. No. 30
-
 0:41
0:412026 NFL Draft Grades: Raiders Select Fernando Mendoza No. 1
-
 1:45
1:45Can Fernando Mendoza Change the Raiders' Fortunes?
-
 17:10
17:10The Making of an NFL-Ready Prospect in the 2026 Draft
-
 6:41
6:41Breaking Down No. 1 Prospect Fernando Mendoza
Top Ricky Seals-Jones News
-
Ricky Seals-Jones: Reaches injury settlement
Seals-Jones (foot) was released by the Colts after the two parties agreed on an injury settlement Wednesday, Aaron Wilson of KPRC 2 Houston reports.
Seals-Jones was set to miss the entirety of the 2023 season while on the Colts' injured reserve, but he will now be free to sign elsewhere. The tight end will have to prove his health prior to earning another opportunity.
... See More ... See Less -
Colts' Ricky Seals-Jones: Lands on IR
The Colts placed Seals-Jones (foot) on injured reserve Tuesday.
Seals-Jones departed practice on a cart Aug. 17. His right foot and ankle were wrapped upon exiting, but the precise nature and extent of the injury haven't been made clear. The veteran tight end didn't play at all last season, and he could miss 2023 as well unless he and the Colts agree on an injury settlement.
... See More ... See Less -

-
Colts' Ricky Seals-Jones: Carted off practice field
Seals-Jones left Thursday's practice on a cart with an apparent right foot injury, Joel A. Erickson of The Indianapolis Star reports.
The tight end signed with the Colts on Aug. 9 and was fighting for a roster spot. Seals-Jones was released with an injury settlement by the Giants before the 2022 campaign after catching 90 passes in 54 games over five previous NFL seasons.
... See More ... See Less -
Colts' Ricky Seals-Jones: Joins Indy
Seals-Jones agreed to a contract with the Colts on Wednesday, Tom Pelissero of NFL Network reports.
The tight end had been a free agent since landing on the Giants' injured reserve list before being released on an injury settlement ahead of the 2022 season. Seals-Jones caught 90 passes for 1,044 yards and 10 touchdowns in five previous NFL campaigns, but he's fighting just to stick on an NFL roster at this stage of his career. The 28-year-old will battle for a depth role as training camp continues.
... See More ... See Less -
Ricky Seals-Jones: Works out for Colts
Seals-Jones was among several tight ends to work out for Indianapolis on Wednesday, Aaron Wilson of ProFootballNetwork.com reports.
Seals-Jones began training camp with a good chance to be the Giants' starting tight end this season, but he hurt his toe very early in camp and was eventually released with an injury settlement. He now appears to be healthy and will try to latch on with the Colts, who currently have only one healthy tight end (Kylen Granson) on the active roster with both Mo Alie-Cox (ankle) and Jelani Woods (shoulder) missing practice Wednesday.
... See More ... See Less -

-
Ricky Seals-Jones: Released with injury settlement
The Giants released Seals-Jones (toe) from injured reserve with an injury settlement Thursday, Aaron Wilson of ProFootballNetwork.com reports.
Seals-Jones was slated to miss the entire 2022 campaign after being placed on IR, but he'll now be free to join a new team once he clears his current toe issue. The 27-year-old tight end appeared in 13 games for Washington last year and caught 30 of 49 targets for 271 yards and two scores.
... See More ... See Less -
Giants' Ricky Seals-Jones: Placed on IR
Seals-Jones was placed on injured reserve Tuesday due to a toe injury, Jordan Raanan of ESPN.com reports.
Seals-Jones can't play for the Giants this season, but he might be able to play for another team if he reaches an injury settlement. It's also possible this is truly a season-ending injury, as Seals-Jones otherwise seemed to be right in the mix for snaps in arguably the weakest TE room in the league. Rookie Daniel Bellinger got most of the first-team snaps in the Giants' first two preseason games and had a costly drop-turned-interception in the second one.
... See More ... See Less -
Giants' Ricky Seals-Jones: Set to claim roster spot
Seals-Jones (undisclosed) should claim a roster spot heading into the 2022 campaign, Dan Duggan of The Athletic reports.
The tight end hasn't practiced since the second day of camp while dealing with an unspecified injury, but he seems all but guaranteed to make the final roster after signing with New York in March. There's no word on if Seals-Jones will be healthy for the start of the year, but he will in all likelihood split reps with Daniel Bellinger on the Giants' offense when he returns to the field.
... See More ... See Less -
Giants' Ricky Seals-Jones: Still sidelined Sunday
Seals-Jones (undisclosed) won't play Sunday against Cincinnati, Pat Leonard of the New York Daily News reports.
Seals-Jones didn't play in last week's preseason opener against the Patriots and will miss a second consecutive matchup to begin the preseason. His final chance to see some game action prior to the regular season will be Aug. 28 against the Jets.
... See More ... See Less -
Giants' Ricky Seals-Jones: Unlikely to play
Seals-Jones (undisclosed) is unlikely to play Thursday in the Giants' first preseason game, Art Stapleton of The Bergen Record reports.
Seals-Jones has been absent from the practice field for much of training camp, and he was also involved very little during minicamp. A specific injury has still yet to be reported. Seals-Jones was expected to compete with 2022 fourth-round pick Daniel Bellinger and offseason signee Jordan Akins for the leading spot on the Giants' tight end positional depth chart. However, the more time Seals-Jones misses, the harder it's going to be for him to nab the No. 1 spot.
... See More ... See Less -
Giants' Ricky Seals-Jones: Misses another practice
Seals-Jones (undisclosed) missed a fifth straight practice Wednesday, Dan Duggan of The Athletic reports.
No injury has been reported, but that's the most likely explanation for his continued absence. Pat Leonard of the New York Daily News notes that Seals-Jones didn't get much run in spring practices either, after signing with the Giants in March. The team's other candidates for tight-end targets are former Texan Jordan Akins and rookie fourth-round pick Daniel Bellinger.
... See More ... See Less -
Giants' Ricky Seals-Jones: Misses third straight practice
Seals-Jones did not participate in Monday's practice, marking the third consecutive session he's missed, Dan Duggan of The Athletic reports.
It's unclear if Seals-Jones is dealing with an injury, and he certainly has plenty of time to ramp into shape before the season begins, but his absence from practice is notable because he's in a competition for New York's starting tight-end role. The veteran came into camp with a slight inside edge for the gig, but the Giants also brought in ex-Texan Jordan Akins this offseason and selected Daniel Bellinger in the fourth round of the draft, and either player could pull ahead of Seals-Jones on the depth chart with a strong preseason.
... See More ... See Less -

-
-

-
-

-

Player Bio
| HT/WT: 6-5, 243 lbs |
| Birthplace: Houston, TX |
| Age: 31 |
| School: Texas A&M |
| Experience: 6 |