- Draft Prep Tiers: C | 1B | 2B | SS | 3B | OF | SP | RP
- Heath's Sleepers | Breakouts | Busts | Hitter regression candidates
- Scott's Top 100 prospects | Sleepers | Breakouts | Busts
We're constantly adding new abbreviations, statistics, and measurements in the wonderful world of baseball analysis. It can be a little overwhelming, I'm sure. With that in mind, I'd like to give you a short primer on what I'm specifically looking for when I put together my list of regression candidates for the 2018 season.
None of these measurements are particularly groundbreaking, but I'm also not sure they're all completely mainstream either.
First, if you're into short cuts, just go to Fangraphs advanced pitching leaderboard from 2017. Sort by "E-F" either direction and you'll find a lot of the guys below. Why? It's ERA minus FIP (Fielding Independent Pitching). It's a fairly strong indicator or whose ERA should have been higher or lower last year.
You can also go two columns to the right and sort by SIERA (Skill-Interactive ERA), which is generally accepted as a more predictive measurement than FIP. If a pitcher had a wide chasm between his SIERA and his ERA, he may just be a regression candidate. But next we need to ask why.
The first two things I'm looking at are BABIP (Batting Average On Balls In Play) allowed and LOB% (Left On Base percentage). These two measurements are not entirely beyond a pitcher's control, but they are the most likely places you're going to find evidence of a pitcher who just got flat out unlucky the previous year. I'm interested in comparing what they did in relation to their career norms and the current league environment.
Two other numbers you'll want to check out are HR/FB rate and xFIP, which factors in home run luck. While home runs are much more common than they used to be, they're still a fairly rare (but hugely impactful) event for a starting pitcher. A 10 percent swing can make a big difference.
A less-advanced number to look at is win-loss record. As much as I hate it, wins have a huge impact on a pitcher's value. It's also the thing that has the least to do with the actual pitcher's performance. Zack Greinke and Trevor Bauer both won 17 games last year. Greinke threw 26 more innings and gave up 10 fewer earned runs.
With that in mind, who should we expect to regress in 2018? Let's take a look.
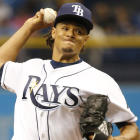
Chris Archer
Tampa Bay Rays SP
|
| Archer's E-F was 0.68 last year, the 4th highest in baseball. Yes, that makes him a "positive" regression candidate. I'm starting with those guys to hammer home the idea that "regress" means "worse". While it is true that Archer's FIP has looked better than his ERA for three straight years, the difference has never been as big as it was last year. For the second consecutive year his HR/FB rate was among the highest in baseball. You can attribute that to getting hit really hard (39 percent hard contact rate against) in 2017, however that mark was 20 percent higher than his career rate so, again, expect some regression. Archer's SIERA and FIP have pretty consistently lived in the low-to-mid 3s and that's about where I would expect his ERA to be in 2018. |
Tanner Roark
Washington Nationals SP
|
| Tanner Roark has a 75 percent career LOB%. He's been very good at stranding runners over his career. Last year that number fell to 66 percent. This, despite the fact that he posted a career high 8.24 K/9. Which, of course, makes little sense. If you strike more hitters out, if anything you should have a higher LOB%. Don't be surprised if Roark chops a half a run (or more) off his 2017 ERA. |

Masahiro Tanaka
New York Yankees SP
|
| Masahiro Tanaka was one of nine pitchers in 2017 to have a K% above 25 percent and a BB% below seven percent. The other eight all had an ERA below 3.5. Tanaka's was 4.74. So what went wrong? Basically everything. Tanaka surrendered a career-high .305 BABIP (26 points higher than his career average), had a LOB% four points lower than his career average, and posted the highest HR/FB rate in the major leagues (21.2 percent). Tanaka's health will always be a concern, but if he stays healthy you should expect one of the biggest bouncebacks in baseball. |
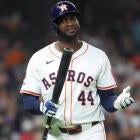
Gerrit Cole
Houston Astros SP
|
| While there were a ton of things to go wrong for Tanaka, it was mostly just home runs for Gerrit Cole . Cole gave up a 15.9 percent HR/FB rate in 2017. He had never allowed a rate higher than 10 percent in his career. That was the difference between being a high 3s ERA pitcher and a low 4s. With Cole moving to a more hitter-friendly park in Houston, you might be worried that he'll be even worse in 2018. I expect the opposite. |
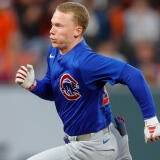
Jose Quintana
Chicago Cubs SP
|
| Jose Quintana is a guy we always thought should win more games. He's thrown more than 1,100 innings with a 3.53 ERA, and yet his all-time record stands at .500. He is one of six pitchers in the history of baseball to have 180 starts of an ERA+ of 115 or better and not have a winning record. But that regression is a long time coming. What's new, is that Quintana also had some bad home run and strand rate luck in 2017. While his 4.15 ERA may look like he dropped off last year, his 3.68 FIP shows he's the same reliable pitcher he's always been. Hopefully, with more wins. |
Robbie Ray
Arizona Diamondbacks SP
|
| Now we get into what you thought I meant when I said regression: Those guys who probably won't be as good next year. The last three seasons, Ray has posted a FIP between 3.53 and 3.76 all three years. His ERA has fluctuated from a high of 4.90 in 2016 to last year's sparkling 2.89. That makes a little sense because he Ks and walks so any hitters that there are fewer balls in play, so more room for variance. I like Ray, and he's one of the best strikeout pitchers in baseball. But even with the humidor , you shouldn't expect an ERA below 3.4 in 2018. |
Lance Lynn
Minnesota Twins SP
|
| Lance Lynn finally found a home with the Twins, but things were almost certainly going to get worse for him in 2018 no matter where he ends up. For one thing, he's in the AL now, so no more easy outs against hapless pitchers. But the biggest problem is he wasn't actually that good last year. Lynn's E-F was a league worst -1.39. His SIERA was 4.85 (right between Matt Moore and Ricky Nolasco ). Lynn is an innings eater who needs good fortune to do that effectively. |
Marcus Stroman
Toronto Blue Jays SP
|
| I've never been as big of a Marcus Stroman guy as many seem to be. But I did acknowledge that his profile as a ground ball pitcher with great control could lead to a Dallas Keuchel like season at some point. Well, he just had it... kind of. Stroman's 3.09 ERA was the ninth best mark in baseball. What's weird is that his 3.90 FIP was the worst mark of his career. His K/9 was right at his career norm and his walks were actually up. So what happened? He stranded almost 80 percent of the runners who reached base. I wouldn't expect that again. Especially with a shoulder injury bothering him in spring. |
Gio Gonzalez
Washington Nationals SP
|
| Speaking of incredible strand luck, Gio Gonzalez everyone! Gonzalez had the fourth highest LOB% in baseball at 81.6 percent last year. That's how someone with a 4.41 SIERA posts a 2.96 ERA. It also helped him reach 200 innings for the first time since 2011. I would not expect a repeat of that at all. |
Zach Davies
Milwaukee Brewers SP
|
| Zach Davis struck out 5.8 batters per nine innings, the fifth lowest mark among qualified pitchers. His SIERA was 4.72. Only 11 qualified starters were worse by that measure. Somehow he posted an ERA below four and won 17 games. If Quintana had this kind of luck, he might win 30 games. There is absolutely no reason to believe Davies will come anywhere close to those marks in 2018. |
Ervin Santana
Minnesota Twins SP
|
| Ervin Santana is going to miss the first month of the season with an injury, which should cool his ADP off by itself. But I'm not even sure you need to draft him. Santana had a 4.46 FIP, a 4.77 xFIP and a 4.60 SIERA in 2017. He doesn't get strikeouts. He's constantly walking a tight rope and now he's a month behind everyone else. I'll pass. |
![[object Object] Logo](https://sportshub.cbsistatic.com/i/2020/04/22/e9ceb731-8b3f-4c60-98fe-090ab66a2997/screen-shot-2020-04-22-at-11-04-56-am.png)


