What is the best defensive stat?
We conclude our three-part series on sorting through what are the "best" mainstream, primary stats with the wild, wild west. While no stats are even close to being perfect, offense and pitching have several metrics that are pretty well-regarded and can be counted on as accurate. Defense, on the other hand, is still kind of the great wide open.
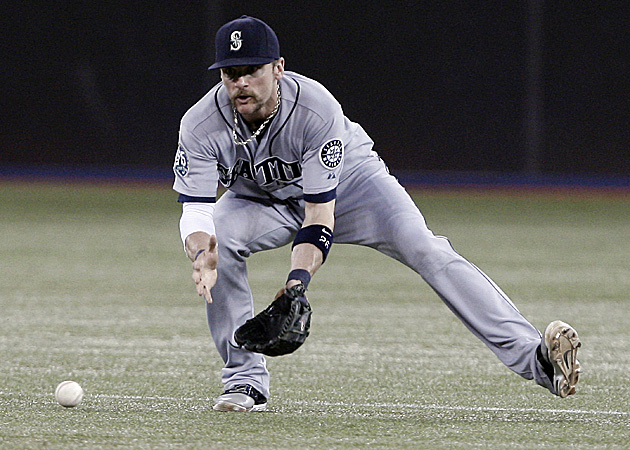 |
| Brendan Ryan is regarded as a defensive whiz in some circles, but how do we measure it? (Getty Images) |
We conclude our three-part series on sorting through what are the "best" mainstream, primary stats with the wild, wild west: defense. While no stats are even close to being perfect, offense and pitching have several metrics that are pretty well-regarded and can be counted on as accurate. Defense, on the other hand, is still kind of the great wide open.
Sure, we can measure errors, and thus, fielding percentage, but even those are left up to the individuals who are the official scorers in the 30 ballparks. And even if errors were uniformly called, there are major flaws.
Let us dive in and try to figure out what is the best defensive stat upon which to judge an individual or team. - Matt Snyder
| Eye on Baseball |
| Offseason stat series |
The Candidates
Fielding percentage/Errors (FLD%/E): Fielding percentage measures the number of chances (putouts plus assists plus errors) that are converted without making an error. So if a player has three putouts, one assist and one error in a game, his fielding percentage is .800.
This is a necessary stat, so please don't let the detractions make you believe I hate it. If a player makes a lot of errors, he's a bad defender, plain and simple. Thus, fielding percentage and/or looking at the number of errors players make can help us determine who the worst defenders are. It's just that these two stats cannot be used to help us determine who the best are. Most sure-handed? OK, granted, but not necessarily the best.
How can this be? Well, it's very simple. One cannot make an error if he cannot get to a ball. Allow an absurd example to illustrate: We could park Rod Barajas, Gerald Laird and David Ortiz at the three outfield spots and they might never make an error. Would a 1.000 fielding percentage from that trio in the outfield be better than a Mike Trout, Michael Bourn and Austin Jackson outfield with a few errors? Think about that one.
Obviously that is hyperbole, but don't lose the very clear point: We have to have some ability to account for range in deciding the best defenders. Fielding percentage cannot possibly do that for us because, again, one cannot commit an error if he can't get to a ball. Brendan Ryan is an outstanding shortstop, but not just because he had a .985 fielding percentage last year.
The rest of these statistics attempt to quantify range in addition to accounting for errors. -- Snyder
Defensive Efficiency Rating (DER): DER is pretty simple in concept: It's the percentage of balls in play (i.e., fair batted balls that stay in the park) that a defense converts into outs. When you think about it, that's sort of the whole point, right? As you might have surmised, this is a team-based stat, and it's a pretty nifty one at that. One of many advantages DER has over fielding percentage is that it necessarily accounts for range. It doesn't matter if it's a readily playable ball or one hit in a very inconvenient spot; it only matters whether it falls for a hit or results in a putout. Unlike fielding percentage, a team isn't "rewarded" for not getting to a ball.
Each year, the best teams will post a DER of more than .700, while the teams at the back end will hover around .670. - Dayn Perry
Ultimate Zone Rating (UZR): In my opinion, UZR constitutes the best attempt to date to quantify individual defensive contributions. Broadly speaking, UZR divides the diamond into many different fielding zones, tracks batted balls and then compares fielders to the "out rate" of an average defender covering the same zones. The defender's percentage of outs made is then converted into a run value, which is then submitted to the full complement of contextual adjustments (ballpark, batter handedness, speed of batted balls, pitcher tendencies and so on). As you can see, a lot goes into the sausage. UZR/150 is simply those UZR run values scaled to a rate of runs saved (or not saved) per 150 games. If an SAT-style analogy helps, then think of it as earned runs : ERA :: UZR : UZR/150 (earned runs are to ERA as UZR is to UZR/150).
With all that said, there are problems. First, UZR isn't useful in small samples -- even single-season samples aren't particularly illuminating. You really need at least three years before you can draw any conclusions about UZR data. On a more fundamental level, UZR is compromised by the fact that it leans heavily upon stringers who make subjective judgments about a batted ball's location and trajectory off the bat. The human element and all that. Even with those imperfections, though, UZR is still a far cry better than fielding percentage. -- Perry
Plus/Minus: The idea is simple -- how may runs does a fielder save (or give away) over the average fielder. To gather this information Baseball Info Solutions not only reviews video, but also employs spotters who record every batted ball and how it's hit and where it's hit. That's all entered into a computer, which analyzes and spits out the Plus/Minus, more or less. - C. Trent Rosecrans
Range factor: Range factor is simply the number of plays a player makes in a game -- putouts plus assists, divided by innings played, multiplied by nine. Because different positions get more chances, it's really best used to compare players at the same position. Better fielders get to more balls and have a higher range factor. Range factor can be skewed by some positions, such as first base and catcher. It can also be affected by a pitching staff. - C. Trent Rosecrans
Staff Picks
Snyder: Eyeballs
While I will look at all of the above stats -- particularly plus-minus and UZR -- nothing feels perfect enough just yet. I'd still rather watch the kind of jumps players get on balls and nothing is more pleasing to me than watching outfielders like the aforementioned Trout/Bourn/Jackson trio at getting to balls in the outfield.
Rosecrans: None
Honestly, I don't know. I look at all of them and I'm still not sure I have a favorite. I think we're still in the wild west of defensive statistics. I know fielding percentage is incredibly flawed and should in no way be used as an example of why a fielder is good (but, well, if he's bad, he's bad, and fielding percentage can show that). I like plus/minus and think UZR has its place if used correctly, but overall, I'm still waiting for something I can truly embrace. There are new systems on the frontier that could change the way we see defense, but it's not here (or at least available to the common man) yet.
Perry: DER
In evaluating teams, I lean heavily on DER, which is available at Baseball-Reference.com and the park-adjusted variety (abbreviated PADE), which is available at Baseball Prospectus. As I mentioned above, DER outputs capture the entire raison d'être of the team defense: taking balls in play and making lovingly crafted outs from them. While fielding percentage is a reasonable attempt at gauging a team's ability to make the routine play, that consideration is already a part of DER, which takes the necessary additional steps to incorporate range.
When it comes to individual fielders, I consider myself a "consensus fetishist." That is, I'm somewhat willing to take the advanced metrics at their word if they're all in agreement. They have enough flaws that I don't place too much emphasis on any single one, but if they're saying the same thing, and that thing squares with my personal observations, then I'm putting more weight on them.
I have no doubt that one day we'll be able to paint an accurate statistical picture of defense at the individual level, but I don't believe we're there just yet.
For more baseball news, rumors and analysis, follow @EyeOnBaseball on Twitter, subscribe to the RSS feed and "like" us on Facebook.