What is the best pitching stat?
Our Eye on Baseball crew has identified 10 candidates as possibly the best stat in baseball for judging pitchers. Who is the winner? We make our picks and ask for you to make yours.
 |
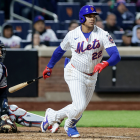
| King Felix's average record in the past three seasons is 13-12, so he's mediocre, right? (US Presswire) |
In continuing with our three-part series on deciding the best primary stat upon which to judge, we're looking now at the pitchers.
I would apologize in advance for the lengths that I went to convince you W-L record sucks, but I actually believe I was as brief as possible. -- Matt Snyder
The Candidates
Record -- wins and losses (W-L): I will attempt to stay calm, but it's pure lunacy how many people hold this "stat" in high regard. It's a team measure, and we're using it to judge individuals. Pitchers cannot control the defense being played behind them and, in the AL, have absolutely nothing to do with their run support. As far as the NL, expecting pitchers to significantly impact the offense is akin to relying on centers to produce from behind the three-point line in basketball.
In addition to all of the above, consider that a pitcher for Team A could work 8 2/3 shutout innings before being removed with a 1-0 lead. A relief pitcher can allow a game-tying solo home run to Team B before recording one out. Then, Team A wins in the bottom of the ninth inning. The starting pitcher for Team A gets a no-decision while the reliever gets the win.
Not only that, but a pitcher could get a loss while allowing zero earned runs in a complete game, but a pitcher could also get a win after allowing eight earned runs in five innings.
Also, what do Matt Harrison, Lance Lynn, A.J. Burnett, Tim Hudson, Phil Hughes, Ian Kennedy, Barry Zito, Jason Vargas and Clayton Richard have in common? They had more wins than Felix Hernandez in 2012. Anyone wanna take any of those guys instead of King Felix on your team?
As for the "a pitcher's job is to win games" argument, I'd actually disagree. His job is to put his team in position to win the game by limiting the amount of runs scored by the opposition (ERA, FIP), taking pressure off his defense by not allowing many baserunners (WHIP) and striking hitters out (K rate) and by taking pressure off his bullpen by working deep into the game (IP, CG). This is a chicken-and-egg scenario. The egg is the pitcher doing his job; the chicken is the team winning the game after the pitcher and his teammates do their jobs. -- Snyder
| Eye on Baseball |
| Offseason best stats series |
Saves (SV): First, let's review the rulebook definition of a save.
Rule 10.20 in the Official Rule Book states:
Credit a pitcher with a save when he meets all three of the following conditions:
(1) He is the finishing pitcher in a game won by his club; and
(2) He is not the winning pitcher; and
(3) He qualifies under one of the following conditions:
-- (a) He enters the game with a lead of no more than three runs and pitches for at least one inning; or
-- (b) He enters the game, regardless of the count, with the potential tying run either on base, or at bat, or on deck (that is, the potential tying run is either already on base or is one of the first two batsmen he faces; or
-- (c) He pitches effectively for at least three innings. No more than one save may be credited in each game.
The save could be a pretty harmless addition to the statistical pantheon if we didn't lacquer it with so much importance. It has problems, you see.
Foremost among those problems is that the definition is too permissive. For instance, according to general run-expectancy charts, a home team up by one run to start the ninth has an 84.1% chance of winning. To be sure, there's nothing wrong with giving a save to a pitcher who protects a one-run, ninth-inning lead, but that does give you an idea of the decidedly "closer-friendly" odds in play.
And what of "three-run lead in the ninth" save situation? The team protecting that lead has better than a 97% chance of winning. Why is succeeding under those circumstances a point of distinction? The save statistic could be drastically improved by tightening the parameters.
There are various "tough save" subsets out there, but the takeaway is that looking at raw save totals doesn't begin to give insight into which late-inning reliever was the best or will be the best moving forward. A nice step would be awarding a save only when the tying run is at bat or on base; otherwise, the statistic as originally conceived is just too permissive. -- Dayn Perry
Earned run average (ERA): The stalwart rate stat of pitching measures, ERA is the number of earned runs a pitcher gives up per nine innings. ERA has its flaws, such as the definition of an error seemingly being different in all 30 ballparks and that a bad defense ends up hurting a pitcher's ERA over the long haul, even though said pitcher can't control that. Still, this is comfortable and there isn't a single stat that is flawless. -- Snyder
ERA plus (ERA+): It's also known as adjusted ERA, and it's just that -- an ERA adjusted according to the pitcher's ballpark and the rest of the leagues. It's the pitching version of OPS+ and, like that stat, it uses 100 as its baseline -- 100 is the average season. Because it starts with the basis of ERA, it has all those inherent flaws but also the common language of ERA. Like OPS+, it's a wonderful tool when comparing different performances over different seasons -- so you can see what other pitchers (or more importantly, offenses) were doing at that time and how much the environment mattered. That doesn't mean that, just because it was a "pitching-heavy" year, it'll hurt a pitcher in retrospect using ERA+ -- in fact, it's just the opposite in the case of Bob Gibson's magical 1968 season. In the "year of the pitcher," Gibson put up a ridiculous 1.12 ERA. Even though other pitchers were succeeding, none were like Gibson, whose ERA+ of 258 that season is the seventh-best single-season mark in history. The best of the modern era is Pedro Martinez's 291 in 2000, when he won his second Cy Young with a 1.74 in the midst of a historic offensive era. -- C. Trent Rosecrans
Fielding independent pitching (FIP, xFIP): FIP constitutes an attempt to decouple a pitcher's skills from those of the defense playing behind him. Generally speaking, a pitcher exerts the most control over these elements of the hurler-batter encounter: whether the pitch is a ball or a strike, whether the ball is put in play, whether the ball stays on the ground or is hit in the air and whether a batted ball stays in the park. What becomes of a ball in play is mostly a function of luck and the defense playing behind the pitcher in question (see, for instance, any discussion on the concept of batting average on balls in play).
FIP, which is available at FanGraphs, is in essence an answer to the question: What would a pitcher's ERA be if you replaced his luck and defense with average luck and defense? It's scaled to ERA, which means that a good ERA (2.75, for instance, whereas 4.00 would be roughly average) is also a good FIP.
As you might have guessed, the components of FIP are a pitcher's home runs and walks allowed and also his strikeouts. Courtesy of FanGraphs, here's a helpful and aesthetically pleasing tutorial:
The value of FIP is that it's a better predictor a pitcher's future ERAs than is his ERA itself.
xFIP takes things a step further by making adjustments for a pitcher's home runs allowed as a percentage of fly balls (HR/FB). HR/FB is a figure that, despite some year-to-year fluctuations, tends to hover around a universal mean. So by adding a pitcher's fly-ball percentage and HR/fly-balls rate to the calculus, you can add another layer of accuracy to FIP. Exceptions? Yes, as with all things. Some pitchers have an established tendency to over- or under-perform expected HR/FB rates. So for those, FIP is probably a better measure. -- Perry
Strikeout to walk ratio (K/BB): You can't simply look at strikeout-to-walk ratio and make firm judgments about a pitcher. But as supporting evidence goes, it's one of the most useful "eyeball" stats out there.
In a very real way, the most fundamentally essential thing a pitcher can do is control the strike zone -- i.e., throw strikes that aren't readily hittable or throw balls that induce "chase" swings. While there are other factors baked into K/BB ratio (e.g., the hitter's plate discipline, the home-plate umpire's zone, the catcher's ability to frame pitches, the ballpark visuals and hitting background), it's still a good thumbnail indicator of how well a pitcher is faring in terms of his most basic job description. Want to make your own minor improvements to the stat? Remove intentional walks from the calculation. -- Perry
Strikeouts/Strikeout rate (K, K/9, K%): One of the silliest things in baseball now is the idea of a war between scouts and the "numbers guys." In the end, that war was settled peacefully long ago. In the end, both are looking for the same thing; they might just be using different terminology and looking in different places. If you get the most grizzled scout out from behind his JUGS gun and the nerdiest, palest stat guy out from his mother's basement, both would tell you they'd prefer to find a pitcher who misses bats. If the batters can't put the ball in play, they're not going to be hitting a pitcher, and that's a good thing. How do you determine that? Well, strikeouts, of course. Strikeout rate (whether it's K/9, as in strikeouts per nine innings or K%, as in strikeout percentage) tells you just that -- how often you strike out the batter. The more strikeouts, the less likely a hitter is putting the ball in play and the fewer things that can go wrong. Sure, as Crash Davis said, strikeouts are fascist. But you know who likes fascists? Those who benefit from the fascist. And you know who likes strikeout pitchers? Everyone on their side. -- Rosecrans
Walks and hits per inning pitched (WHIP): Not to pick on my sportswriting brethren, but I read another one of those ridiculous columns where the columnist thinks they're funny by throwing out a ton of acronyms and the joke was all these "made up" stats are ridiculous and too difficult to figure out. It's a total hack concept, one that was tired before Moneyball was even published, yet misidentified and misunderstood as it by so many who haven't actually read the book. But what was funny was that this particular columnist mentioned WHIP as one of his "complicated" statistics. I literally laughed out loud. WHIP is the most uncomplicated statistic in baseball that isn't a simple counter. Unlike ERA or batting average or the "traditional" stats that have a long list of rules, WHIP is simply what it says it is -- Walks + Hits/Innings Pitched. WHIP. It's incredibly simple -- and useful. It's basically how many baserunners you allow (not accounting for errors). The fewer baserunners, the fewer chances for runs. The fewer runs, the better chance you have of winning the game. -- Rosecrans
Innings pitched (IP): This won't be the winner, but it has become an incredibly underrated stat for starting pitchers. The pitchers with the most innings pitched each season are invariably among the best -- top five in MLB this past season were Justin Verlander, R.A. Dickey, Felix Hernandez, Clayton Kershaw and James Shields. Not only is it pretty obvious that the best pitchers last the longest in games, but logging a heavy innings workload eases the burden on the bullpen, which is a huge boost for the team as a whole. Complete games -- and, of course, shutouts -- can be lumped in here to an extent. -- Snyder
Wins above replacement pitcher (WAR): Ah, yes, the firebrand WAR. Like its position-player cousin, pitcher WAR is denominated in hypothetical runs and tied to a "replacement player" baseline, which is the kind of run prevention you'd receive from the typical pitcher you dig up in an emergency: the waiver claim, the minor-league veteran, the mid-grade prospect.
It's essential to note that there are two moderately dueling definitions of pitcher WAR. Broadly speaking, the one put forth by FanGraphs is based on FIP (see above!), while the version made available by Baseball-Reference.com is grounded in runs/game.
Broadly speaking, the FanGraphs variant (typically abbreviated as fWAR) is more useful if you're interested in knowing how the pitcher fared in terms of the elements most under his control and making predictions about his future performances. The Baseball-Reference take (bWAR), in my opinion, is best used in assigning value to past performances (filling out a Cy Young ballot, for instance). Both have their merits and are nifty additions to the toolbox. -- Perry
Exhausted yet? Well, we still have to make our picks.
Staff picks
Matt Snyder: WHIP
My first answer is anything but wins and losses. Saves aren't overly helpful either. After that, unlike with hitters, I don't think there are one or two stats head and shoulders above the rest. Like I said in the record entry above, the best pitchers need to do a combination of things to help their teams win. I haven't totally gotten on board with FIP, so I would look at ERA, IP, K, K/BB, K/9, CG, SHO and WHIP in deciding who to endorse for Cy Young in a given season. At fictional gunpoint to choose the best overall, though, I'll go with WHIP, due to it being the kind of like the pitcher's version of on-base percentage (which you know I love).
C. Trent Rosecrans: WHIP
Like Dayn says, I'm not a big believer in a single statistic to tell me everything. Sure, it'd be nice to have one, but I don't think there is one. And as much as I like strikeout rates and strikeout to walk ration, strikeouts aren't the only way to record outs. Now, if you can strike out a ton of batters and not walk many, I want you on my squad. But I'd also like a guy who might give up a few more hits but still finds ways to get outs and can thrown 220 innings in a year. In the end, though, I love the simplicity of WHIP and it tells me one of the most important things I can determine about a pitcher -- how many guys he puts on base (and thus, how many outs he converts). It's like the pitcher's version of on-base percentage. If you only let one guy on base per inning, chances are you're not giving up a lot of runs, and that's a sound strategy for winning.
Dayn Perry: bWAR
I don't believe in single-shot metrics for hitters, so it goes without saying that I don't believe in them for pitchers. If I'm talking about value in a given season that has already happened, I'll turn to innings, runs-per-game, K/unintentional walk ratio, K%, ERA+ and bWAR. If I'm looking to project performance outward, I'll use things like FIP, BABIP, K%, K/UBB, ground-ball rate, swing-and-miss %, fWAR. If profiling a reliever, I'll raise the performance bar a bit. I don't care about wins or saves in the least. If forced under pain of imprisonment to pick one stat, I'd go with bWAR.
Now it's your turn, readers. What is the best primary stat upon which to judge a pitcher?
For more baseball news, rumors and analysis, follow @EyeOnBaseball on Twitter, subscribe to the RSS feed and "like" us on Facebook.