


Next Game
Probable Pitchers
-

- P. Lambert HOU
- 1-1, 3.27 ERA, 1.27 WHIP
-

- C. Bassitt BAL
- 1-2, 6.75 ERA, 2.06 WHIP
Now Playing
Share Video
Link copied!
-
 8:28
8:28Most Added Players! Addison Barger or CES?
-
 1:58
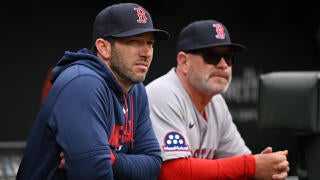
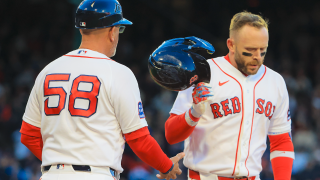
1:58Highlights: Red Sox at Orioles (4/26)
-
 0:58
0:58How High Is the Panic Meter for the Boston Red Sox?
-
 10:49
10:49Weekend Waiver Wire Adds! Ranking Closer Options!
-
 0:20
0:20The first ABS walk-off in history
-
 0:51
0:51Sammy Basallo Makes History with First ABS Walk-Off
-
 0:41
0:41Julian McWilliams: ABS Challenge System Is "Like Cinema"
-
 1:03
1:03All Eyes On The Hammate Bone
-
 15:21
15:21Spring Training Believe It Or Not!
-
 0:58
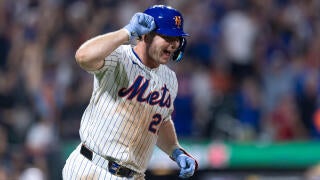
0:58Impact Of Pete Alonso On Orioles This Season
-
 11:34
11:34Top 5 Outfield Prospects for 2026 Redraft Leagues!
-
 1:12
1:12Biggest Winner From Winter Meetings
-
 0:54
0:54Pete Alonso Set to Meet with Red Sox, Orioles at Winter Meetings
-
 10:19
10:19Top-24 Starting Pitchers for 2026!
-
 8:58
8:58Will These Strong Finishes Affect 2026 Value?
-
 12:52
12:52Outfield & Starting Pitcher Questions for 2026 Drafts!
-
 9:04
9:04Week 26 Preview: Schedule, Sleepers & Two-Start Pitchers
-
 0:38
0:38Highlights: Orioles at Padres (9/2)
-
 1:33
1:33Highlights: Orioles at Padres (9/1)
-
 8:56
8:56Waiver Wire MUST ADDS! Ranking Pitchers, Stash Jonah Tong!
This page may contain affiliate links. If you click and sign up, make a deposit, or place a wager, we may earn a commission at no additional cost to you.
Top Christian Encarnacion-Strand News

-

-
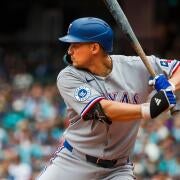
Orioles' Christian Encarnacion-Strand: Acquired by Baltimore
The Reds traded Encarnacion-Strand to the Orioles on Monday in exchange for cash considerations.
Encarnacion-Strand failed to make the Reds' Opening Day roster and was DFA'd by the team this past Wednesday. He'll get a new opportunity with the Orioles, and while he's been assigned to Triple-A Norfolk, Encarnacion-Strand could see some major-league action at first base due to the absence of Ryan Mountcastle (foot). Across 10 games in Triple-A this season, Encarnacion-Strand has gone 8-for-36 (.222) with five runs scored, two homers and eight RBI.
... See More ... See Less -
Reds' Christian Encarnacion-Strand: Removed from 40-man roster
The Reds designated Encarnacion-Strand for assignment Wednesday.
The transaction clears a spot on the 40-man roster for the addition of P.J. Higgins. Encarnacion-Strand looked like a potential building block for the Reds a couple years ago, but he's struggled at the big-league level since the beginning of the 2024 campaign and has dealt with numerous injuries. He's still just 26 and has plenty of power potential, so there should be some interest in Encarnacion-Strand via waivers.
... See More ... See Less -
Reds' Christian Encarnacion-Strand: Moved to minor-league camp
The Reds optioned Encarnacion-Strand to minor-league camp Monday.
Encarnacion-Strand entered spring training looking like a long shot to make the team, and coming to camp with a hamstring injury didn't help his chances. He's healthy now but will begin the season at Triple-A Louisville.
... See More ... See Less -
Reds' Christian Encarnacion-Strand: Making first spring start
Encarnacion-Strand (hamstring) will serve as the Reds' designated hitter and bat seventh in Saturday's Cactus League game against the Brewers.
Encarnacion-Strand missed the Reds' first several spring contests while recovering from a hamstring injury he suffered in January. He's now been given the green light to return to a competitive environment, but a late start won't help his already slim chances of making Cincinnati's Opening Day roster.
... See More ... See Less -

-
-
Reds' Christian Encarnacion-Strand: Could get into games next week
Reds manager Terry Francona said Thursday that Encarnacion-Strand (hamstring) could play in Cactus League games next week, Charlie Goldsmith of Fox 19 Now Cincinnati reports.
Encarnacion-Strand has been slowed early on in camp by a hamstring injury he suffered in January, but he's been working out and it seems he'll miss only the first few spring training games. Given the number of bodies ahead of him at the infield corners and designated hitter, the 26-year-old is facing long odds to make the Opening Day roster.
... See More ... See Less -
Reds' Christian Encarnacion-Strand: Recovering from hamstring injury
Reds manager Terry Francona said Thursday that Encarnacion-Strand is behind schedule after suffering a hamstring injury in January, Charlie Goldsmith of Fox 19 Now Cincinnati reports.
Encarnacion-Strand is on a running program, so he is improving, but he could miss the first few Cactus League games. The 26-year-old infielder slashed just .208/.234/.377 across 137 plate appearances last season and looks to be a bit buried on the Reds' depth chart.
... See More ... See Less -

-

-

-
-
Reds' Christian Encarnacion-Strand: Demoted to minors
The Reds optioned Encarnacion-Strand to Triple-A Louisville on Saturday.
Encarnacion-Strand has seen his playing time dwindle over the past several days, and Jake Fraley's (shoulder) return from the IL will now leave the former without a spot on the active roster. The 25-year-old Encarnacion-Strand has slashed .208/.234/.377 across 137 plate appearances this season.
... See More ... See Less -
Reds' Christian Encarnacion-Strand: On bench again
Encarnacion-Strand went unused off the bench in Wednesday's 7-2 win over the Marlins.
Since Noelvi Marte's return from the injured list last Friday, Encarnacion-Strand has started once over the last five games. For now, Marte and Spencer Steer will continue to garner most of the starts at the corner-infield spots, while Austin Hays and Gavin Lux appear set to share left field and the designated-hitter spot when the Reds face right-handed pitching. Encarnacion-Strand has batted just .179 over his last 17 games, and with his playing time on the downswing, he could soon be headed for a demotion to Triple-A Louisville.
... See More ... See Less -
Reds' Christian Encarnacion-Strand: Losing out on playing time
Encarnacion-Strand is out of the lineup for Monday's game against the Marlins.
With Noelvi Marte returning from the injured list Friday, the Reds' position-player group is now back to full strength with the exception of outfielder Jake Fraley (shoulder), who remains on the shelf. As a result of the logjam in the infield, Encarnacion-Strand has unsurprisingly found himself as the odd man out of the lineup more frequently. Encarnacion-Strand will head to the bench for the third time in four games since Marte's activation.
... See More ... See Less -
Reds' Christian Encarnacion-Strand: Taking seat Friday
Encarnacion-Strand is out of the lineup for Friday's game against the Phillies.
The 25-year-old started the previous four games and has been a lineup regular since returning from lower-back inflammation in early June, but Noelvi Marte's (oblique) activation from the injured list Friday leaves Cincinnati with a crowded infield. Encarnacion-Strand has a .723 OPS since coming back from his injury and could be the odd man out for the Reds, though he still seems likely to receive semi-regular starts.
... See More ... See Less -
Reds' Christian Encarnacion-Strand: Out after fouling ball off foot
Encarnacion-Strand is not in the lineup for Wednesday's game in Boston after fouling a ball off the top of his foot earlier in the day, Charlie Goldsmith of Fox 19 Now Cincinnati reports.
The Reds and Red Sox resumed Tuesday's suspended game earlier Wednesday, and Encarnacion-Strand was removed in the bottom of the eighth after getting hurt in his at-bat in the previous half inning. Manager Terry Francona didn't disclose whether Encarnacion-Strand underwent X-rays following his removal from the contest. With Encarnacion-Strand on the bench for the second game of the day, the Reds will turn to Santiago Espinal to cover third base.
... See More ... See Less -
Reds' Christian Encarnacion-Strand: Launches grand slam in win
Encarnacion-Strand went 2-for-5 with a grand slam and a second run scored in Wednesday's 8-4 win over the Red Sox.
After fouling a ball off his foot in the continuation of a suspended game earlier Wednesday, Encarnacion-Strand was able to rejoin the lineup in the nightcap and proved to be the difference maker. The 25-year-old first baseman blasted a 439-foot grand slam off Greg Weissert to put the Reds ahead 4-3 in the seventh inning. It's the first homer since June 8 for Encarnacion-Strand, who'd gone 8-for-51 (.157) with an ugly .362 OPS in his last 15 games. He's now slashing .206/.233/.381 with six homers, 19 RBI and 13 runs scored through 133 plate appearances this season.
... See More ... See Less -
Reds' Christian Encarnacion-Strand: Cleared to start Wednesday
Encarnacion-Strand (foot) will start at first base and bat eighth in Wednesday's game against the Red Sox.
Earlier Wednesday, the Reds and Red Sox resumed their suspended game from Tuesday. Encarnacion-Strand started that game at third base and went 1-for-3 before being lifted in the bottom of the eighth inning after he had fouled a ball off his foot in the top of the frame. The Reds didn't include him in their initial lineup for Wednesday's scheduled game, but Encarnacion-Strand will end up starting after Spencer Steer was scratched due to a hand injury that he suffered earlier in the day when he was hit by a pitch. Though Encarnacion-Strand may not be 100 percent while he tends to the foot issue, the Reds evidently felt that Steer was more in need of rest and recovery for the nightcap.
... See More ... See Less
Player Bio
| HT/WT: 6-1, 224 lbs |
| Birthplace: Walnut Creek, CA |
| Age: 26 |
| Experience: 3 |
| Bats/Throws: R, R |