


Next Game
Sun, Apr 26 @
1:00 pm ET |
ESPN

vs
4
Cleveland Cavaliers
(52-30)
- Scotiabank Arena
-
TOR +3.5, O/U 220.5
Now Playing
Share Video
Link copied!
-
 1:52
1:52Raptors Cut Series Deficit to 2-1 vs. Cavaliers
-
 1:04
1:04First Round Game 3 Highlights: Cavaliers at Raptors
-
 1:41
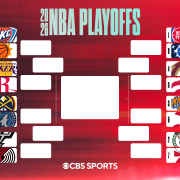
1:41How to Play Raptors-Cavaliers Series
-
 10:06
10:06Breaking Down the Giannis Antetokounmpo Trade Market
-
 1:56
1:56NBA Futures: Series Moneyline Bet
-
 2:31
2:31Raptors, Magic, 76ers Battling To Avoid Play-In Tournament
-
 1:18
1:18Race To Avoid Eastern Conference Play-In Remains Uncomfortably Close
-
 0:45
0:45Highlights: Raptors at Pistons (3/31)
-
 1:27
1:27Wemby, Spurs Look For 10th Straight Win As They Head To Toronto
-
 1:27
1:27NBA-Best Thunder Beat Raptors Without SGA
-
 1:46
1:46Report: Raptors and Kings In Talks About Domantas Sabonis Trade
-
 1:55
1:55Which Eastern Conference Team Would Be Best Fit For Ja Morant?
-
 1:16
1:16Trading Ja Morant To Toronto On The Trade Machine
-
 1:15
1:15Could Ja Morant Be The Third Star Toronto Needs?
-
 18:29
18:29One Trade Every Eastern Conference Team Needs To Make
-
 1:32
1:32Highlights: Knicks at Raptors (12/9)
-
 1:27
1:27Brunson 35 Points Propels Knicks To The Semifinals
-
 1:31
1:31Surprise Of The East: Toronto Raptors
-
 0:51
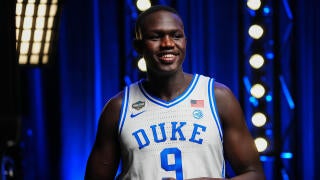
0:512025 NBA Mock Draft: Tim Doyle Reacts to Raptors Selecting Khaman Maluach
-
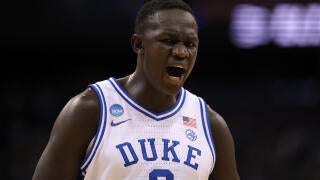 0:53
0:532025 NBA Mock Draft: Raptors Select Khaman Maluach Number 9 Overall
This page may contain affiliate links. If you click and sign up, make a deposit, or place a wager, we may earn a commission at no additional cost to you.
2025 Stats
| STATS |
MPG
Minutes Per Game
|
PPG
Points Per Game
|
FG%
Field Goal Percentage
|
RPG
Rebounds Per Game
|
APG
Assists Per Game
|
|---|---|---|---|---|---|
| Regular Season | 9.4 | 3.4 | 57.3 | 2.7 | 0.7 |
| Post Season | 2.0 | 1.0 | 0.0 | 0.5 | 0.0 |
Top Trayce Jackson-Davis News
-
Raptors' Trayce Jackson-Davis: Available Sunday
Jackson-Davis (illness) is available for Sunday's game against the Nets, Esfandiar Baraheni of The Athletic reports.
Jackson-Davis will be available to return from a two-game absence due to an illness. However, he isn't guaranteed to see meaningful run while buried behind Jakob Poeltl, Sandro Mamukelashvili and Collin Murray-Boyles.
... See More ... See Less -
Raptors' Trayce Jackson-Davis: Questionable for Sunday
Jackson-Davis (illness) is questionable for Sunday's game against the Nets, Esfandiar Baraheni of The Athletic reports.
Jackson-Davis missed Friday's loss to the Knicks due to an illness, but there's a chance he could be cleared for the Raptors' regular-season finale. Check back for official word on his status closer to Sunday's tipoff.
... See More ... See Less -
Raptors' Trayce Jackson-Davis: Out again Friday
Jackson-Davis (illness) is out for Friday's game against the Knicks, Steve Popper of Newsday reports.
Jackson-Davis is not a usual rotation player for Toronto, so his absence doesn't carry many fantasy implications. He's made 13 appearances since the All-Star break, playing double-digit minutes only once.
... See More ... See Less -
Raptors' Trayce Jackson-Davis: Out with illness
Jackson-Davis (illness) is out for Thursday's game against Miami.
Jackson-Davis is an emergency depth piece for the Raptors, so his absence will not have a big fantasy impact. He's appeared in eight of Toronto's past 10 games, playing double-digit minutes only once.
... See More ... See Less -
Raptors' Trayce Jackson-Davis: Returns from G League stint
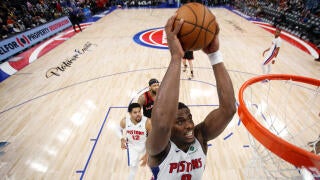
The Raptors recalled Jackson-Davis from the G League's Raptors 905 on Wednesday.
Jackson-Davis wasn't available for the Raptors' 127-116 loss to Detroit on Tuesday while he was on assignment in the G League, but he'll suit up for the parent club in the second leg of its back-to-back set Wednesday versus the Kings. The third-year big man received some extended run Tuesday with the 905 in a 120-105 loss to the Motor City Cruise in the first round of the G League playoffs, playing 28 minutes and finishing with 18 points (5-10 FG, 4-5 FT), eight rebounds, five assists, three steals and three blocks.
... See More ... See Less -
Raptors' Trayce Jackson-Davis: Available to play
Jackson-Davis (knee) is available for Sunday's game versus the Magic, Josh Lewenberg of TSN.ca reports.
Jackson-Davis is set to return after a one-game absence, though he remains a fringe piece in Toronto's rotation. Over the past three games, he's logged just 17 total minutes, producing a total of three points, two rebounds, one assist, one steal, one block and two turnovers.
... See More ... See Less -
Raptors' Trayce Jackson-Davis: Could return Sunday
Jackson-Davis (knee) is listed as questionable for Sunday's game against the Magic, Blake Murphy of Sportsnet.ca reports.
Jackson-Davis was held out of Friday's game against the Magic due to right knee tendinitis. However, he hasn't seen consistent minutes off the bench for the Raptors since being acquired by the team from the Warriors in early February. Jackson-Davis won't be a prominent member of Toronto's rotation for as long as Collin Murray-Boyles (back), Jakob Poeltl and Sandro Mamukelashvili are available.
... See More ... See Less -
Raptors' Trayce Jackson-Davis: Won't suit up Friday
Jackson-Davis has been ruled out for Friday's game against New Orleans due to right knee tendinitis.
Jackson-Davis has played sparingly of late, but he may have tweaked his knee at some point during his four-minute appearance in the Raptors' 119-94 loss to the Clippers. His absence Friday shouldn't affect the Toronto rotation.
... See More ... See Less -
Raptors' Trayce Jackson-Davis: Back with parent club
Toronto recalled Jackson-Davis from the G League's Raptors 905 on Tuesday.
Jackson-Davis will rejoin the parent club after recording 22 points, nine rebounds, five assists, two steals and two blocks Tuesday in the 905's 123-122 win over the Motor City Cruise. He'll be available off the bench for Wednesday's game in Chicago but is unlikely to be featured in the rotation.
... See More ... See Less -
Raptors' Trayce Jackson-Davis: Assigned to G League
Jackson-Davis was assigned to the G League's Raptors 905 on Tuesday, Blake Murphy of Sportsnet.ca reports.
Jackson-Davis will be available to play in Raptors 905's matchup against the Motor City Cruise on Tuesday following this transaction. He hasn't seen much NBA action of late, averaging 2.0 rebounds in 2.8 minutes over four appearances since Feb. 28, so this will be an opportunity for the Indiana product to stay sharp.
... See More ... See Less -
Raptors' Trayce Jackson-Davis: Minimal runtime in return
Jackson-Davis (finger) totaled zero points (0-3 FG, 0-2 FT), four rebounds and two assists across three minutes during Wednesday's 122-111 loss to New Orleans.
Jackson-Davis was given the green light to suit up for Wednesday's contest after missing the two games prior due to a dislocated finger. However, even with Collin Murray-Boyles (thumb) sidelined, Jackson-Davis saw just three minutes of court time in the second half. Jackson-Davis played 10 minutes or more in his first two appearances with the Raptors in February, but he has seen minimal playing time since the All-Star break. He's unlikely to start seeing consistent minutes unless Jakob Poeltl or Sandro Mamukelashvili were to miss time along with Murray-Boyles.
... See More ... See Less -
Raptors' Trayce Jackson-Davis: Available Wednesday
Jackson-Davis (finger) is available for Wednesday's game against the Pelicans, Vivek Jacob of the Raptors' official site reports.
Jackson-Davis is ending a two-game absence caused by a dislocated finger. With Jakob Poeltl now healthy following an illness, Jackson-Davis isn't in position to play a meaningful role.
... See More ... See Less -
Raptors' Trayce Jackson-Davis: Questionable for Wednesday
Jackson-Davis (finger) is questionable for Wednesday's game against the Pelicans, per Blake Murphy of Sportsnet.ca.
Jackson-Davis is looking to end a two-game absence with a dislocated finger. However, he may not see meaningful playing time even if he's available Wednesday.
... See More ... See Less -
Raptors' Trayce Jackson-Davis: Out for Tuesday
Jackson-Davis (finger) is listed out for Tuesday's game against the Rockets.
Jackson-Davis dislocated his right middle finger during pregame warmups prior to Sunday's 122-92 win over the Mavericks and will now miss his second straight game. Even when healthy, Jackson-Davis has typically been outside of the Toronto rotation.
... See More ... See Less -
Raptors' Trayce Jackson-Davis: Out with dislocated finger
Jackson-Davis dislocated the middle finger on his right hand while going through pregame warmups and won't play Sunday against the Mavericks, Michael Grange of Sportsnet.ca reports.
Jackson-Davis has been a negligible part of the rotation in Toronto, so his absence Sunday won't have any bearing on how head coach Darko Rajakovic distributes the minutes in the frontcourt. The center's next chance to play will come Tuesday in Houston.
... See More ... See Less -
Raptors' Trayce Jackson-Davis: Returns to parent team
Toronto recalled Jackson-Davis from the G League's Raptors 905 on Saturday.
Jackson-Davis will be available for the Raptors' next game Sunday against the Mavericks after logging a double-double in a 30-minute appearance for the 905 on Friday. At the NBA level, Jackson-Davis is averaging 3.8 points, 3.0 rebounds, 0.8 assists and 0.5 blocks in 10.4 per game this season between stops with Golden State and Toronto.
... See More ... See Less -
Raptors' Trayce Jackson-Davis: Garbage-time appearance
Jackson-Davis supplied one rebound over zero minutes during Wednesday's 110-107 loss to San Antonio.
Jackson-Davis continues to serve as nothing more than an emergency piece, logging fewer than five minutes for the fourth straight game. Since arriving in Toronto, he has failed to have any sort of real impact, with the majority of his playing time coming at the backend of games.
... See More ... See Less -
Raptors' Trayce Jackson-Davis: Double-doubles in Toronto debut
Jackson-Davis logged 10 points (2-4 FG, 6-10 FT), 10 rebounds, one assist, one block and one steal over 16 minutes during the Raptors' 122-104 win over the Pacers on Sunday.
Jackson-Davis was cleared to make his Raptors four days after being acquired from the Warriors, and he saw meaningful minutes off the bench in the absence of Jakob Poeltl (back). Jackson-Davis gave the Pacers fits on the boards, logging a season-high eight offensive rebounds, which led to him attempting 10 free throws for the first time this season. With Collin Murray-Boyles and Sandro Mamukelashvili also on the roster, it's unclear what kind of playing time Jackson-Davis will see once Poeltl is cleared to return.
... See More ... See Less -
Raptors' Trayce Jackson-Davis: Cleared for Toronto debut Sunday
Jackson-Davis (recently traded) is available for Sunday's game against the Pacers, Blake Murphy of Sportsnet.ca reports.
Jackson-Davis was acquired by the Raptors from the Warriors on Wednesday in exchange for a second-round pick, and the third-year center is ready to make his debut with his new team Sunday. He averaged 4.2 points, 3.1 rebounds and 0.9 assists over 11.4 minutes per game with the Warriors this season, though his playing time fluctuated over the course of the season. It'll be interesting to see what Jackson-Davis' role with the Raptors will be, especially with Jakob Poeltl (back) nearing a return from an extended absence, during which Sandro Mamukelashvili and Collin Murray-Boyles both took on expanded roles.
... See More ... See Less -
Raptors' Trayce Jackson-Davis: Sent to Toronto
The Warriors traded Jackson-Davis to the Raptors on Wednesday in exchange for a 2026 second-round pick, Shams Charania of ESPN reports.
Jackson-Davis will depart the Warriors after two-plus seasons with the team. The 25-year-old big man appeared in 36 games for Golden State, averaging 4.2 points and 3.1 rebounds across 11.4 minutes. With Jakob Poeltl (back) out indefinitely, Jackson-Davis will jockey with Collin Murray-Boyles, Sandro Mamukelashvili and Jamison Battle for frontcourt minutes.
... See More ... See Less
Player Bio
| HT/WT: 6-9, 245 lbs |
| Birthplace: Greenwood, IN |
| Age: 26 |
| School: Indiana |
| Experience: 2 |