This page may contain affiliate links. If you click and sign up, make a deposit, or place a wager, we may earn a commission at no additional cost to you.
Cubs' Pete Crow-Armstrong: Two hits, two runs scored in win
Rotowire
Crow-Armstrong went 2-for-4 with a double and two runs scored in Tuesday's 10-4 win over the Phillies.
It was Crow-Armstrong's second multi-hit game of April, and his third-inning double off Aaron Nola was just PCA's second extra-base hit of the month. After opening the season in the cleanup spot for the Cubs, Crow-Armstrong has been hitting near the bottom of the lineup for the past couple weeks as he looks to find his swing. The 24-year-old is slashing .221/.264/.294 with one home run, five RBI, 11 runs scored, four stolen bases and a 3:22 BB:K across 72 plate appearances. He continues to struggle badly against left-handed pitching, hitting .148 with one extra-base hit and a 0:12 B:K over 28 plate appearances versus southpaws.
... See More... See Less
Cubs' Pete Crow-Armstrong: Pops first home run
Rotowire
Crow-Armstrong went 3-for-5 with a solo home run, a stolen base and three total runs scored in Tuesday's 9-2 win over the Rays.
After smacking 31 home runs during the regular season last year, Crow-Armstrong had yet to find his power stroke before Tuesday, but he's now on the board with his first long ball of 2026. The talented outfielder also recorded his fourth stolen base through 11 games. Crow-Armstrong had a 30-30 campaign in 2025, and his ability to both hit the ball over the wall and swipe a base gives him a ton of upside from a fantasy perspective moving forward, especially if he goes on a power surge in the near future.
... See More... See Less
Cubs' Pete Crow-Armstrong: Steals base in loss
Rotowire
Crow-Armstrong went 1-for-3 with a double, a stolen base and a run scored in Friday's 4-1 loss to the Guardians.
With Cleveland starting lefty Joey Cantillo, Crow-Armstrong slid down to eighth in the order, but he still managed to make an impact. The speedy outfielder has stolen three bases through seven games and is batting a respectable .269, but his .629 OPS reflects a lack of power so far. Friday's double was the first extra-base hit of the season for Crow-Armstrong, who is still in search of his first 2026 home run after going deep 31 times during the regular season last year.
Cubs' Pete Crow-Armstrong: Swipes two bags in big win
Rotowire
Crow-Armstrong went 2-for-4 with a walk, two runs scored and two stolen bases in Saturday's 10-2 win over the Nationals.
After swiping a career-high 35 bags on 43 attempts last season, Crow-Armstrong was successful on his first two tries in 2026. The 24-year-old center fielder is off to a hot start at the plate, going 4-for-9 in two games with a 1:3 BB:K, but he's still looking for his first extra-base hit of the year.
... See More... See Less
Cubs' Pete Crow-Armstrong: Drives in two Opening Day
Rotowire
Crow-Armstrong went 2-for-5 with two RBI in Thursday's 10-4 loss to the Nationals.
The Cubs put Crow-Armstrong in the cleanup spot Opening Day, and he responded with a team-best two RBI. After a breakout 2025 campaign, the young outfielder inked a six-year, $115 million contract extension earlier this week. Crow-Armstrong did fade some down the stretch last year, however, which is something he will aim to avoid in 2026. He made some minor mechanical tweaks in the offseason in an effort to make his swing more compact and find a bit more consistency at the plate across the long season.
Cubs' Pete Crow-Armstrong: Inks extension with Chicago
Rotowire
The Cubs and Crow-Armstrong reached an agreement Monday on a six-year, $115 million contract extension, Patrick Mooney of The Athletic reports.
Crow-Armstrong is coming off a stellar sophomore season in which he hammered 31 home runs and swiped 35 bags while playing in 157 of 162 games during the regular season. His patience is expected to pay off tremendously after he declined to participate in extension talks ahead of the 2025 season. With his finances now in order, the 23-year-old can focus solely on putting together another terrific campaign as Chicago's everyday center fielder.


 1:27
1:27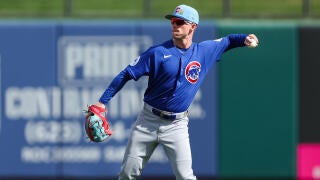 0:29
0:29 10:43
10:43 12:52
12:52 10:24
10:24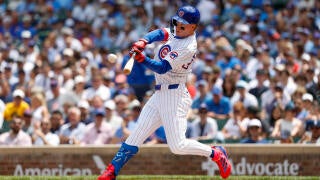 1:20
1:20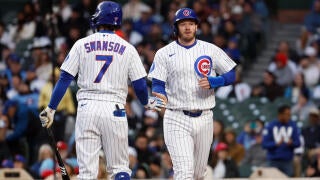 0:37
0:37 10:49
10:49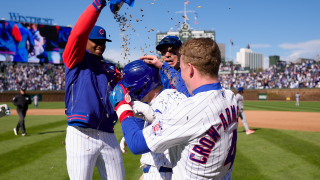 1:32
1:32 1:13
1:13 10:26
10:26 1:20
1:20 1:04
1:04 0:51
0:51 1:06
1:06 9:27
9:27 1:14
1:14 1:00
1:00