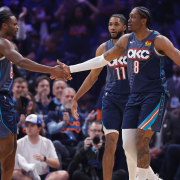
Thunder's Shai Gilgeous-Alexander: Notches 31 points in Game 4
Rotowire
Gilgeous-Alexander had 31 points (10-17 FG, 2-4 3Pt, 9-11 FT), two rebounds, eight assists and one block in 38 minutes during Monday's 131-122 win over the Suns in Game 4 of the first round of the Western Conference playoffs.
The Thunder easily coasted by the Suns to sweep this series. Gilgeous-Alexander was terrific throughout the series, posting averages of 33.8 points, 8.0 assists, 3.8 rebounds and 0.8 blocks in 35.8 minutes per contest.
... See More... See Less
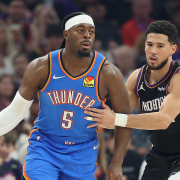
Thunder's Shai Gilgeous-Alexander: Drops in 42 points in win
Rotowire
Gilgeous-Alexander finished Saturday's 121-109 win over the Suns in Game 3 of the first round of the Western Conference playoffs with 42 points (15-18 FG, 1-3 3Pt, 11-12 FT), four rebounds, eight assists and one steal in 38 minutes.
Gilgeous-Alexander got whatever he wanted, slicing through the Suns' defense with ease and opening the game with nine straight makes. He didn't miss his first shot until midway through the third quarter and finished with a new playoff career-high in points. The Thunder will be looking to end the Suns' season in Phoenix on Monday.
... See More... See Less
Thunder's Shai Gilgeous-Alexander: Nears double-double in win
Rotowire
Gilgeous-Alexander supplied 37 points (13-25 FG, 2-5 3Pt, 9-9 FT), nine assists, five rebounds and one steal across 38 minutes in Wednesday's 120-107 Game 2 win over the Suns in the first round of the playoffs.
Gilgeous-Alexander turned in an efficient performance en route to a game-high 37 points, leading the Thunder to a 2-0 series lead. He also paced all players in assists and has dished out at least seven dimes in all six of his April appearances across the regular season and playoffs. The superstar point guard and the Thunder will now head to Phoenix for Game 3 on Saturday, aiming to take a commanding 3-0 lead.
Thunder's Shai Gilgeous-Alexander: Propels Thunder to victory
Rotowire
Gilgeous-Alexander provided 25 points (5-18 FG, 0-4 3Pt, 15-17 FT), four rebounds, seven assists and two blocks over 29 minutes during Sunday's 119-84 victory over the Suns in Game 1 of the first round of the Western Conference playoffs.
Gilgeous-Alexander wasn't required to do a lot as the Thunder easily accounted for the Suns in Game 1 of the playoffs. Despite shooting just 5-for-18 from the floor, Gilgeous-Alexander still crafted his way to a team-high 25 points thanks to an extremely busy and efficient night from the charity stripe. The two teams will face each other again Wednesday, where Oklahoma City will look to take a commanding 2-0 lead.
Gilgeous-Alexander (oblique) isn't listed on the injury report for Sunday's Game 1 against the Suns.
Gilgeous-Alexander was held out of Oklahoma City's final two regular-season games but will return for the start of this first-round series against Phoenix. The superstar point guard averaged 29.0 points, 6.5 assists, 3.3 rebounds and 1.1 steals in 31.7 minutes per game over his last 10 regular-season outings.
Thunder's Shai Gilgeous-Alexander: Won't play Sunday
Rotowire
Gilgeous-Alexander (oblique) has been ruled out for Sunday's game against the Suns.
The Thunder are listing 10 players out for Sunday's regular-season finale, including Gilgeous-Alexander. However, the superstar should be good to go by the playoffs. Nikola Topic and Jared McCain should see significant minutes in the backcourt once again Sunday.
Thunder's Shai Gilgeous-Alexander: Won't play against Denver
Rotowire
Gilgeous-Alexander (oblique) won't play in Friday's game against the Nuggets, Clemente Almanza of USA Today reports.
Oklahoma City has a lock on the top spot in the Western Conference, so Gilgeous-Alexander will take the night off against Denver. With Ajay Mitchell (ankle), Alex Caruso (rest), Isaiah Joe (knee) and Cason Wallace (toe) also unavailable, Jared McCain and Nikola Topic should see more minutes, with at least one of them in line to enter the starting lineup.
... See More... See Less
Thunder's Shai Gilgeous-Alexander: Extends streak in Wednesday's win
Rotowire
Gilgeous-Alexander totaled 20 points (9-17 FG, 2-6 3Pt, 0-1 FT), one rebound, 11 assists, one block and one steal across 30 minutes during Wednesday's 128-110 win over the Clippers.
Despite sitting out the entire fourth quarter, Gilgeous-Alexander was able to extend his NBA record streak of games with at least 20 points to 141, while producing his eighth double-double of the season -- one short of his career high. Three of them have come in the last 15 games, a stretch in which the reigning MVP is averaging 29.3 points, 7.1 assists, 3.9 boards, 1.7 threes and 1.5 steals while shooting 57.0 percent from the floor and 40.3 percent from beyond the arc.
... See More... See Less
Thunder's Shai Gilgeous-Alexander: Drops game-high 25 in rout
Rotowire
Gilgeous-Alexander recorded 25 points (10-15 FG, 2-2 3Pt, 3-3 FT), one rebound, eight assists and two steals over 28 minutes during Tuesday's 123-87 win over the Lakers.
Only two Thunder starters scored in double digits, and nine played 30 minutes in a rout, but Gilgeous-Alexander still produced a solid line by his lofty standards. The reigning MVP has drained multiple three-pointers in eight of the last 14 games, averaging 30.0 points, 6.9 assists, 4.1 boards, 1.6 steals and 1.6 threes over that span while shooting 57.3 percent from the floor and 41.1 percent from beyond the arc.
Thunder's Shai Gilgeous-Alexander: Hits for 20 points in easy win
Rotowire
Gilgeous-Alexander closed with 20 points (7-10 FG, 2-3 3Pt, 4-5 FT), four rebounds, seven assists and one steal across 24 minutes during Sunday's 146-111 win over Utah.
Gilgeous-Alexander didn't play much due to the nature of the game, as the Thunder cruised to an easy victory against one of the worst teams in the Western Conference, but the reigning MVP still reached the 20-point mark. He has hit this threshold in every game so far in 2025-26. The Thunder have tough matchups in the final week of the regular season with scheduled games against the Lakers, Clippers, Nuggets and Suns. However, since the team has yet to lock up the No. 1 seed in the West, expect Gilgeous-Alexander to continue handling his regular workload on offense.


 1:06
1:06 12:36
12:36 1:52
1:52 1:58
1:58 1:00
1:00 0:53
0:53 1:58
1:58 1:47
1:47 0:55
0:55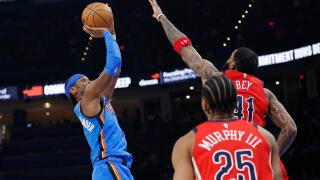 0:53
0:53 1:36
1:36 1:56
1:56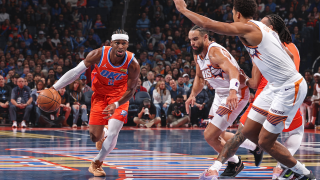 3:20
3:20 1:31
1:31 1:39
1:39 1:12
1:12 1:09
1:09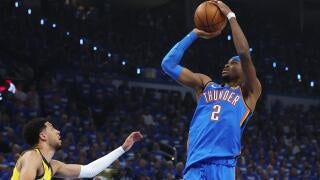 2:02
2:02 1:50
1:50 1:56
1:56