


Now Playing
Share Video
Link copied!
-
 9:20
9:20Biggest Questions for the NFC West After the 2026 Draft
-
 17:53
17:53Pete Prisco's Post-NFL Draft Power Rankings
-
 9:45
9:45Ryan Wilson's Best & Worst 2026 NFL Draft Classes
-
 2:00
2:00George Pickens Yet To Sign Franchise Tag With Cowboys
-
 1:28
1:28Why LB Jack Campbell May Be Too Costly for the Lions
-
 1:45
1:45What's Next for Bryce Young and C.J. Stroud?
-
 10:07
10:07Post-Draft Breakdown: Biggest Questions in the NFC North
-
 1:21
1:21From NFL Draft To Playoffs: Dallas Cowboys
-
 11:40
11:40Biggest Questions Facing the NFC East Post-Draft
-
 11:21
11:21What's Next For 2026 NFL Season?
-
 0:46
0:462026 NFL Draft Grades: Cowboys
-
 1:54
1:54Dallas Cowboys Had One of the BEST Draft Classes in 2026
-
 0:29
0:292026 NFL Draft Grades: Cowboys Select LT Overton No. 137
-
 0:53
0:532026 NFL Draft Grades: Cowboys Select Jaishawn Barham No. 92
-
 0:50
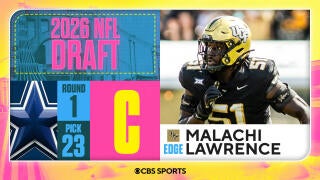
0:50Cowboys Select Edge Malachi Lawrence No. 23 Overall
-
 1:54
1:54Biggest Losers After 1st Round of 2026 NFL Draft: The Steelers
-
 1:51
1:51Biggest Winners After 1st Round: Dallas Cowboys
-
 0:50
0:502026 NFL Draft grades: Cowboys Select Malachi Lawrence at No. 23
-
 0:38
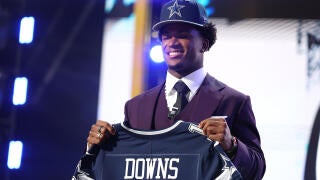
0:382026 NFL Draft Grades: Cowboys Select Caleb Downs No. 11
-
 17:10
17:10The Making of an NFL-Ready Prospect in the 2026 Draft
2025 Receiving
| STATS |
REC
Receptions
|
YDS
Receiving Yards
|
AVG
Average Yards per Reception
|
TD
Receiving Touchdowns
|
LNG
Longest Reception
|
|---|---|---|---|---|---|
| Regular Season | 14 | 120 | 8.6 | 1 | 19 |
| Post Season | 3 | 26 | 8.7 | 0 | 14 |
Top Marquez Valdes-Scantling News


-
Cowboys' Marquez Valdes-Scantling: Inks one-year deal with Dallas
The Cowboys signed Valdes-Scantling to a one-year contract Monday, Tom Pelissero of NFL Network reports.
Valdes-Scantling appeared in 10 regular-season games with the 49ers and Steelers last season, compiling 14 catches for 120 yards and one touchdown. The 31-year-old is joining his fifth team in the last two calendar years and will attempt to win a job with Dallas this summer. He'll compete with Ryan Flournoy, KaVontae Turpin, Jonathan Mingo and others behind CeeDee Lamb and George Pickens.
... See More ... See Less -

-
Steelers' Marquez Valdes-Scantling: Held to 14 catches in 2025
Valdes-Scantling secured 14 of 29 targets for 120 yards and a touchdown over 10 regular-season appearances between the 49ers and Steelers in 2025.
Valdes-Scantling began the 2025 campaign in San Francisco, where he saw limited work despite the team dealing with several absences at wide receiver, as he hauled in just four of eight targets for 40 yards. After being let go by the 49ers, he linked up with the Steelers -- and former teammate Aaron Rodgers -- to close out the year. Valdes-Scantling was slightly more productive in Pittsburgh, but most of his output (eight catches on 16 targets for 55 yards) came in the final two weeks of the regular season when DK Metcalf was suspended. Metcalf is slated to return for the playoffs, so Valdes-Scantling's workload in the postseason will likely be limited. While Valdes-Scantling's role in 2026 will depend on where he ends up, his fantasy upside has been limited over the past few seasons.
... See More ... See Less -

-

-

-

-

-
Steelers' Marquez Valdes-Scantling: Minimal production on nine targets
Valdes-Scantling recorded three receptions on nine targets for 21 yards in Sunday's 13-6 loss to the Browns.
Valdes-Scantling led Pittsburgh in targets in the absence of both DK Metcalf (suspension) and Calvin Austin (hamstring). However, he was unable to get on the same page with Aaron Rodgers, often seemingly a step or more off from where throws arrived. That was particularly noteworthy on the Steelers' final possession, as he was targeted three times unsuccessfully in the end zone to end the game. Even if Austin can return in Week 18 against the Ravens, Valdes-Scantling is likely to see a significant opportunity in a must-win matchup.
... See More ... See Less -

-

-
-
Steelers' Marquez Valdes-Scantling: Targeted three times Sunday
Valdes-Scantling secured one of three targets for six yards during Sunday's 29-24 win over the Lions.
Valdes-Scantling reached the end zone during last week's win over the Dolphins, and he nearly caught a 60-yard touchdown in the third quarter of Sunday's Week 16 victory. However, the ball narrowly slipped through his fingers, and he was shaken up on the play. He returned to the game later in the drive but ultimately finished the matchup with an uninspiring stat line. Valdes-Scantling did rank third among Pittsburgh's wide receivers by playing 42 percent of the team's offensive snaps, but he's secured just two of five targets for 25 yards and a touchdown over his first three appearances with the Steelers.
... See More ... See Less -

-
Steelers' Marquez Valdes-Scantling: Reaches end zone in prime time
Valdes-Scantling secured his lone target for a 19-yard touchdown during Monday's 28-15 win over the Dolphins.
Valdes-Scantling made his second appearance with the Steelers after being signed to the active roster earlier in the day. He was on the field for 52 percent of the team's offensive snaps and reached the end zone early in the third quarter to give Pittsburgh a two-possession lead. Valdes-Scantling's fantasy upside is limited however, after being targeted just once in each of his first two appearances with the team.
... See More ... See Less -
Steelers' Marquez Valdes-Scantling: Getting signed to 53-man roster
The Steelers will sign Valdes-Scantling to the active roster for Monday's game against the Dolphins, Gerry Dulac of the Pittsburgh Post-Gazette reports.
Valdes-Scantling was expected to be elevated from the practice squad for a second time Monday, but Pittsburgh will instead add him to the 53-man squad, making him eligible to suit up for the remainder of the 2025 campaign. He was elevated for the team's Week 14 contest against the Ravens, in which he played 31 percent of the offensive snaps and failed to secure his only target. Valdes-Scantling doesn't stand to provide much fantasy value as the team's No. 4 receiver behind DK Metcalf, Adam Thielen and Calvin Austin.
... See More ... See Less -
Steelers' Marquez Valdes-Scantling: Back with practice squad
Valdes-Scantling reverted to the Steelers' practice squad Monday, per the NFL's official transaction log.
Valdes-Scantling was elevated to the active roster for the first time with Pittsburgh, failing to catch his only target in Sunday's 27-22 win over the Ravens. The wide receiver logged 16 offensive snaps, which was tied for third most at his position with Calvin Austin behind DK Metcalf (43) and Adam Thielen (25). Valdes-Scantling can be elevated two more times before the team would have to officially sign him to the active roster.
... See More ... See Less -
Steelers' Marquez Valdes-Scantling: Active to face Ravens
Valdes-Scantling is active for Sunday's game against the Ravens, Alan Saunders of SteelersNow.com reports.
Valdes-Scantling has been on Pittsburgh's practice squad since early November, and he'll make his team debut roughly one month later. He's likely to serve as the team's fourth receiver behind DK Metcalf, Adam Thielen and Calvin Austin, but he should still find himself on the field for plenty of snaps. While he's reunited with Aaron Rodgers, Valdes-Scantling isn't likely to make a fantasy impact.
... See More ... See Less -
Steelers' Marquez Valdes-Scantling: Elevated from practice squad
The Steelers elevated Valdes-Scantling from the practice squad to the active roster Saturday ahead of Sunday's game versus the Ravens, Teresa Varley of the team's official site reports.
Valdes-Scantling could make his debut with Pittsburgh during Sunday's matchup after joining the practice squad early last month. The 31-year-old caught four passes for 40 yards across five appearances with the 49ers earlier in the season and will likely serve as a depth receiver versus Baltimore.
... See More ... See Less -

Player Bio
| HT/WT: 6-4, 206 lbs |
| Birthplace: St. Petersburg, FL |
| Age: 31 |
| School: South Florida |
| Experience: 9 |