


Now Playing
Share Video
Link copied!
-
 1:15
1:15Pete's Biggest Day 2 Winners: Kansas City Chiefs
-
 0:58
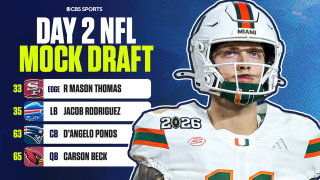
0:582026 NFL Draft Grades: Chiefs Select R Mason Thomas No. 40
-
 1:00
1:00Chiefs Trade Up for CB Mansoor Delane at No. 6
-
 11:24
11:24Breaking Down Josh Edwards' Day 2 NFL Mock Draft
-
 0:34
0:34Mansoor Delane Was The Only Cornerback Taken In The Top 10
-
 0:43
0:432026 NFL Draft Grades: Chiefs Select Peter Woods No. 29
-
 0:45
0:452026 NFL Draft grades: Chiefs trading up for Mansoor Delane at No. 6 shows some desperation
-
 1:48
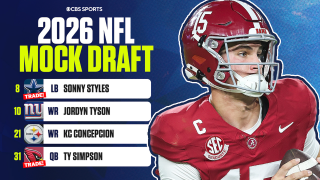
1:48Will Jordyn Tyson Be The Best WR From the 2026 Class?
-
 1:45
1:45Can Fernando Mendoza Change the Raiders' Fortunes?
-
 1:44
1:44Which Defensive Back Will Go First In The NFL Draft?
-
 17:10
17:10The Making of an NFL-Ready Prospect in the 2026 Draft
-
 1:32
1:32Jordyn Tyson Primed to Be First WR Taken
-
 0:45
0:45Favorite NFL Draft Bets: Chiefs Address Secondary
-
 0:41
0:41Rueben Bain Jr. Is The Best Fit For Kansas City At No. 9
-
 0:53
0:53Five Players To Trade Up For: Rueben Bain Jr.
-
 12:10
12:10Breaking Down Bryant McFadden's Mock Draft Trades
-
 1:55
1:55GM Pete Prisco's NFL Draft Proclamations: Chiefs Looking To Trade Up For Pass Rusher
-
 40:07
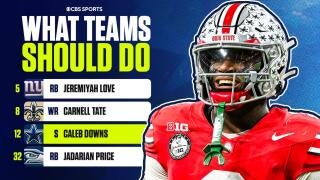
40:07Who They Should Take NFL Mock Draft
-
 1:11
1:11Who They Should Take NFL Mock Draft: Mansoor Delane To Tampa Bay
-
 1:46
1:46Who They Should Take NFL Mock Draft: Kansas City At No. 9
2025 Receiving
| STATS |
REC
Receptions
|
YDS
Receiving Yards
|
AVG
Average Yards per Reception
|
TD
Receiving Touchdowns
|
LNG
Longest Reception
|
|---|---|---|---|---|---|
| Regular Season | 33 | 345 | 10.5 | 1 | 30 |
Top JuJu Smith-Schuster News


-
-

-
-

-
-
Chiefs' JuJu Smith-Schuster: Two grabs to close out season
Smith-Schuster reeled in both of his targets for 13 yards during Sunday's 14-12 defeat to Las Vegas.
Smith-Schuster saw some run early in the season while Rashee Rice was suspended and again at the end with Rice out for the season due to injury, but he also tallied just four catches for 27 yards over seven games in the middle of the season. The veteran wideout finished with only 33 grabs for 345 yards and one touchdown overall and hasn't hit paydirt more than three times in a season since 2020. Smith-Schuster inked just a one-year deal with KC prior to the season, so he'll head into the offseason looking for another deal, whether with the Chiefs or elsewhere.
... See More ... See Less -
-

-
Chiefs' JuJu Smith-Schuster: Trio of grabs in loss
Smith-Schuster brought in all three targets for 16 yards in the Chiefs' 20-13 loss to the Broncos on Thursday night.
Smith-Schuster finished tied for second in receptions and as the runner-up in receiving yards as well, although on a night when Chris Oladokun threw for only 66 yards, that didn't equate to any usable fantasy production. Nevertheless, Thursday marked Smith-Schuster's most productive all-around game in two months, as he hadn't exceeded one reception or 12 receiving yards in any of the previous seven games. Smith-Schuster and the rest of the Chiefs' passing attack will retain a muted fantasy outlook for a Week 18 road matchup against the Raiders with Oladokun under center.
... See More ... See Less -
Chiefs' JuJu Smith-Schuster: One grab in loss
Smith-Schuster caught one of four targets for 12 yards in Sunday's 26-9 loss to the Titans.
With fellow wide receiver Rashee Rice (concussion) sidelined, Smith-Schuster played 41 of the Chiefs' 45 offensive snaps Sunday, his highest snap share of the season. Despite his increased playing time, the veteran wideout was unable to have much of an impact against the Titans while the Kansas City offense struggled without Patrick Mahomes (knee) at the helm. Smith-Schuster's four targets were his most since Week 4, but the 29-year-old remains difficult to trust as the season winds down in what should be an underwhelming aerial attack with Chris Oladokun at quarterback with both Mahomes and Gardner Minshew (knee) on injured reserve. Next up for the Chiefs is a Week 17 matchup against the Broncos.
... See More ... See Less -

-
Chiefs' JuJu Smith-Schuster: Comes up empty in Week 15
Smith-Schuster didn't haul in his lone target during Sunday's 16-13 loss to the Chargers.
Smith-Schuster saw an increase in his snap share Sunday, with Hollywood Brown (personal) out of commission and Tyquan Thornton leaving with a possible concussion. Even so, the veteran wideout wasn't a factor in the offense, and now starting quarterback Patrick Mahomes is done for the year due to a torn ACL. There's little to like about Smith-Schuster's fantasy profile the rest of the way in 2025.
... See More ... See Less -

-

-
Chiefs' JuJu Smith-Schuster: Minimal output versus Houston
Smith-Schuster reeled in one of two targets for five yards during Sunday's 20-10 loss to Houston.
Smith-Schuster ranked third among wideouts in terms of offensive snap share in Sunday's contest, but that amounted to just a 38 percent share. The veteran has claimed no more than one pass in any of the last five contests and has just one touchdown on the ledger in 2025, so he can safely be left on the waiver wire in the vast majority of fantasy formats.
... See More ... See Less -

-
-
Chiefs' JuJu Smith-Schuster: Held without catch in Week 13 loss
Smith-Schuster failed to haul in his lone target during the Chiefs' 31-28 loss to the Cowboys on Thursday.
Smith-Schuster failed to record a catch for the second time in three games, and the 2017 second rounder's 22 snaps on offense was fourth most among Chiefs wide receivers behind Rashee Rice (59), Xavier Worthy (58) and Hollywood Brown (29). Smith-Schuster recorded three catches or more in five of the first seven games of the regular season, but the veteran wideout figures to serve in a rotational role for the rest of the 2025 campaign unless Rice, Worthy or Brown were to miss time.
... See More ... See Less -

-
Chiefs' JuJu Smith-Schuster: Tallies one reception in Week 12
Smith-Schuster notched one reception (on two targets) for eight yards during Sunday's 23-20 overtime victory over the Colts.
Smith-Schuster hasn't tallied more than a single catch in any of the last three games and hasn't cracked double-digits in receiving yards over that span, so there are very few formats in which he should be considered a fantasy option. While he still receives decent run (45 snaps Sunday), he's not in line for many looks in the passing game, barring an absence from Rashee Rice.
... See More ... See Less
Player Bio
| HT/WT: 6-1, 215 lbs |
| Birthplace: Long Beach, CA |
| Age: 29 |
| School: USC |
| Experience: 10 |