


Next Game
Now Playing
Share Video
Link copied!
-
 1:06
1:06First Round Game 3 Highlights: Golden Knights at Mammoth
-
 1:37
1:37Breaking Down the Golden Knights' 2026 Playoff Path
-
 0:57
0:57Mammoth Win 1st Playoff Game, Chance To Win Series
-
 1:05
1:05NHL Stanley Cup Playoffs Betting Preview: Mammoth at Golden Knights
-
 0:20
0:20Highlights: Kings at Mammoth (12/8)
This page may contain affiliate links. If you click and sign up, make a deposit, or place a wager, we may earn a commission at no additional cost to you.
2025 Stats
| STATS |
G
Goals
|
A
Assists
|
P
Points
|
+/-
Plus-Minus Goals Scored For or Against Total
|
TOI/G
Time On Ice Per Game
|
PM
Penalty Minutes
|
|---|---|---|---|---|---|---|
| Regular Season | 25 | 22 | 47 | 6 | 15:59 | 28 |
| Post Season | 0 | 0 | 0 | -2 | 13:45 | 0 |
Top John-Jason Peterka News


-
Mammoth's JJ Peterka: Reaches 25-goal mark
Peterka scored a goal on four shots in Tuesday's 5-3 win over the Jets.
Peterka has three goals over seven games in April. His tally Tuesday got him to the 25-goal mark on the season, a level he's reached in three straight campaigns. He's at 46 points, 156 shots on net and a plus-7 rating over 81 appearances, with his drop from last year's point total (68) being due to less success in setting up teammates and a notably smaller power-play role in his first year with the Mammoth.
... See More ... See Less -
Mammoth's JJ Peterka: Scores in Tuesday's overtime win
Peterka scored a goal on three shots in Tuesday's 6-5 overtime win over the Oilers.
Peterka opened the scoring just 1:53 into the game, though the Mammoth gave the early lead away just 11 seconds later. The 24-year-old winger has three points over his last four outings while continuing to fill a middle-six role. He's up to 24 goals, 45 points, 148 shots on net and a plus-8 rating over 77 appearances. Peterka hasn't found the same quality of opportunities in his first year in Utah as he did over the previous two seasons in Buffalo, leading to a decline in offense.
... See More ... See Less -
Mammoth's JJ Peterka: Nets goal in win
Peterka scored a goal on four shots in Thursday's 6-2 win over the Kraken.
Peterka's tally put the Mammoth ahead 4-2 in the third period, the first of three goals for the visitors in that frame. This ended an eight-game goal drought for the winger, who had three assists in that span. Peterka has struggled with consistency at times this season, and he's also had fairly modest production with no multi-point efforts since Jan. 31 versus the Stars. He's now at 23 goals, 44 points, 143 shots on net and a plus-8 rating over 75 appearances.
... See More ... See Less -
Mammoth's JJ Peterka: Forces overtime Thursday
Peterka scored a goal on two shots in Thursday's 3-2 overtime loss to the Blackhawks.
Peterka has just two goals over seven contests in March, though he's added 18 shots on net. The 24-year-old winger remains in a middle-six role, but he's logged less than 15 minutes of ice time in six straight outings. Through 66 games this season, he has 22 goals, 40 points, 131 shots on net and a plus-8 rating. Without a steady stream of top-line minutes, Peterka is just a fine offense-only option in fantasy.
... See More ... See Less -
Mammoth's JJ Peterka: Nets power-play marker
Peterka scored a power-play goal on five shots in Tuesday's 3-2 win over the Capitals.
Peterka ended a four-game point drought with his tally. The 24-year-old winger was rolling before the Olympic break, but it appears he wasn't able to carry over his momentum from putting up four points in five games with Germany during the tournament. Peterka is up to 21 goals, 39 points (four on the power play), 121 shots on net and a plus-10 rating over 61 outings this season.
... See More ... See Less -
Mammoth's JJ Peterka: Extends point streak
Peterka scored a goal in Monday's 6-2 win over the Canucks.
Peterka found the back of the net late in the second period, and his 20th goal of the campaign gave the Mammoth a commanding 5-1 lead. Peterka also extended his point streak to three games, and he has notched five of those goals over his last 10 outings. Peterka has racked up eight points (five goals, three helpers), a plus-4 rating and 15 shots on goal during that prolific 10-game stretch.
... See More ... See Less -
Mammoth's JJ Peterka: Adds two helpers
Peterka recorded two assists and a plus-2 rating in Saturday's 3-2 loss to the Stars.
Peterka has four goals and three helpers over his last nine outings. He set up both of Kailer Yamamoto's contests in this loss, as their line with Barrett Hayton was the only one to get much going against the Stars. Peterka is up to 37 points (19 goals, 18 helpers), 109 shots on net and a plus-10 rating across 55 appearances.
... See More ... See Less -
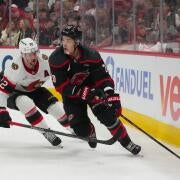
Mammoth's JJ Peterka: Finds twine in loss
Peterka scored a goal in Thursday's 5-4 loss to the Hurricanes.
After Carolina's Shayne Gostisbehere scored late in the third period to tie the game at two apiece, Peterka responded within 19 seconds with a goal of his own to help the Mammoth take the lead back. Overall, the 24-year-old winger is up to 19 goals, 35 points and 108 shots on net across 54 games this season. Over his last eight games, he's been a relatively steady goal scorer with four twine finders to go with an assist and 13 shots on net. While his playmaking this season has taken a step back compared to the 41 helpers he posted with the Sabres a season ago, he's on track to at least match his career high of 28 goals from the 2023-24 campaign. Peterka remains a solid player across most standard fantasy leagues thanks to his high goal-scoring upside.
... See More ... See Less -
Mammoth's JJ Peterka: Deposits empty-netter
Peterka scored an empty-net goal in Saturday's 5-2 win over the Predators.
The tally was awarded, and the winger finished the game with no official shots on net. Peterka has three goals and two assists over his last seven games. He's seeing consistent middle-six minutes and a bit of power-play time. For the season, he's up to 18 goals, 34 points, 104 shots on net and a plus-9 rating through 51 contests.
... See More ... See Less -
Mammoth's JJ Peterka: Finds twine in win
Peterka scored a goal and added two PIM in Wednesday's 5-4 overtime win over the Flyers.
Peterka has four points over his last six games. His goal Wednesday set the Mammoth on the comeback trail after the Flyers scored the first three goals of the contest. Peterka is at 17 goals, 33 points, 104 shots on net and a plus-9 rating across 50 appearances this season while filling a middle-six role.
... See More ... See Less -
Mammoth's JJ Peterka: Goal, assist in win
Peterka scored a goal on two shots, supplied an assist, added two PIM and went plus-2 in Tuesday's 6-1 win over the Maple Leafs.
Peterka stretched the Mammoth's lead to 4-0 at 15:25 of the second period, and he also helped out on a Daniil But tally in the third. This was Peterka's first multi-point effort since his four-point game Dec. 3 versus the Ducks. The 23-year-old winger is up to 16 goals, 32 points, 97 shots on net, 20 PIM and a plus-9 rating through 47 outings overall. He's on pace to finish right around the 27 goals he had last year with the Sabres, but he hasn't done as much playmaking in his first campaign with the Mammoth.
... See More ... See Less -
Mammoth's JJ Peterka: Strikes on power play
Peterka scored a power-play goal on three shots in Monday's 4-3 loss to the Predators.
Peterka's tally opened the scoring at 5:48 of the first period, though Roman Josi evened the score before the midpoint of the frame. The 23-year-old Peterka is now 12 games removed from his last multi-point effort, accumulating three goals and four helpers in those contests. He's produced 15 goals, 28 points, 86 shots on net and a plus-5 rating through 40 appearances this season, while primarily filling a top-six role in his first year with the Mammoth.
... See More ... See Less -
Mammoth's JJ Peterka: Nets goal Sunday
Peterka scored a goal in Sunday's 4-3 overtime win over the Jets.
Peterka hasn't been a consistent goal threat of late, but he's finding ways to get the job done on offense and has cracked the scoresheet in four of Utah's last six games. With 27 points (14 goals, 13 assists) in 38 contests, Peterka should remain a valuable offensive weapon for Utah as long as he stays healthy.
... See More ... See Less -
Mammoth's JJ Peterka: Deposits empty-netter
Peterka scored an empty-net goal on four shots and added two PIM in Friday's 5-3 win over the Kraken.
Peterka had the first of the Mammoth's two empty-netters. The winger is continuing to find success in a top-line role -- he's earned four goals and four helpers over seven contests in December. For the season, he's at 13 goals, 24 points, 68 shots on net and a plus-4 rating across 33 appearances. He's behind the pace necessary to match his 68-point total from 2024-25 with the Sabres, but he's been scoring more efficiently and could finish with his first 30-goal campaign if he doesn't fade in that area.
... See More ... See Less -
Mammoth's JJ Peterka: Racks up four points in win
Peterka scored twice on six shots, added two assists and went plus-3 in Wednesday's 7-0 win over the Ducks.
Peterka's second goal came on the power play, his first contribution with the man advantage all season. The winger has five points over two contests to begin December, which is just one point less than he had in all of November. The 23-year-old is up to 12 goals, 21 points, 60 shots on net and a plus-5 rating through 28 appearances. If he stays on the top line, his offense should continue to surge.
... See More ... See Less -
Mammoth's JJ Peterka: Tallies in loss
Peterka scored a goal on four shots and added two PIM in Monday's 6-3 loss to the Sharks.
Peterka got a chance on the top line with Clayton Keller and Barrett Hayton in this contest. The 23-year-old Peterka cashed in a goal at 16:00 of the first period to cut the Mammoth's deficit to 3-2, but the Sharks took control in the middle frame. The tally ended a four-game slide for Peterka, who had mainly been in a bottom-six role during the slump. He's now at 10 goals, 17 points, 54 shots on net and a plus-2 rating through 27 outings in his first year in Utah.
... See More ... See Less -
Mammoth's JJ Peterka: Nets another goal Saturday
Peterka scored a goal on four shots in Saturday's 3-2 win over the Rangers.
Peterka opened the scoring midway through the first period. The 23-year-old winger is surging with five goals and an assist over his last six games, a quick turnaround after he opened November with five scoreless outings. For the season, he's at nine tallies, 16 points, 43 shots and a plus-2 rating through 22 contests in a middle-six role.
... See More ... See Less -
Mammoth's JJ Peterka: Pots both goals in loss
Peterka scored two goals and added two PIM in Tuesday's 3-2 overtime loss to the Sharks.
Peterka has four goals and an assist over his last four contests, which coincides with a move to the third line. The 23-year-old winger is at eight goals, 15 points, 38 shots on net, eight PIM and a plus-3 rating over 20 appearances to begin his time with the Mammoth. That puts him on pace to top the 60-point mark for the second year in a row, though he's a little short of being on track to match his 68-point output from 77 games a year ago.
... See More ... See Less -
Mammoth's JJ Peterka: Tallies again in overtime loss
Peterka scored a goal on three shots and went minus-2 in Friday's 3-2 overtime loss to the Islanders.
Peterka was dropped to the third line for this contest but still saw 16:25 of ice time. He has three points over his last two games, so he may stay lower in the lineup until his offense fades. Michael Carcone moved up to take his spot on the second line, and Carcone's style is better suited to the bottom six. Overall, Peterka has six goals, 13 points, 36 shots on net and a plus-2 rating over 18 appearances this season.
... See More ... See Less -
Mammoth's JJ Peterka: Earns two points versus former team
Peterka scored a goal on three shots, dished an assist and went plus-2 in Wednesday's 5-2 win over the Sabres.
Peterka snapped a five-game point drought with this effort. He scored the game-tying goal within the first minute of the third period and then set up Lawson Crouse for the eventual game-winner. The 23-year-old Peterka is up to five goals, 12 points, 33 shots on net and a plus-4 rating through his first 17 outings with the Mammoth. He's held onto a second-line role and also sees some power-play time, but with just two multi-point efforts on the year, he's yet to see his offense really come to life this season.
... See More ... See Less
Player Bio
| HT/WT: 5-11, 192 lbs |
| Birthplace: Munich, Germany |
| Age: 24 |
| Experience: 3 |
| Shoots: Left |