The 2020 MLB season will be unlike any other in baseball history. The ongoing COVID-19 pandemic has forced the season to be shortened to 60 games, making it by far the shortest MLB season since 1877, and there will be a universal DH and an extra-inning tiebreaker rule as well. For at least one year, baseball will be a sprint, not a marathon.
Baseball has always been built around numbers and some numbers remain the standard even as statistics get more advanced. A player going 40-40 still resonates. A hitter putting up 30 homers and 100 RBI is generally seen as having a good season. Pitchers still value 200 innings and 20 wins. They've been benchmarks throughout baseball history and remain so today.
The 60-game season will force baseball to recalibrate its statistical benchmarks, at least for one year. Pitchers have no shot at 20 wins and a hitter isn't getting 200 hits this season. What qualifies as good in 2020? Or, more simply, what is the 60-game equivalent of the stat benchmarks we've all come to cherish over the years? That's what we're here to answer.
Home runs (and stolen bases and saves)
| 162-game total | 60-game equivalent |
|---|---|
50 HR | 19 HR |
40 HR | 15 HR |
30 HR | 11 HR |
20 HR | 7 HR |
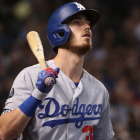
Last season an MLB record 129 players hit 20 home runs. Will anyone get there this season? I'm not sure. Only four players have hit 20 homers in their team's first 60 games the last three years: Aaron Judge (21) in 2017 and Christian Yelich (22), Cody Bellinger (20), and Pete Alonso (20) in 2019. Giancarlo Stanton hit 33 homers in a 60-game span at one point in 2017 though. True story.
Twenty home runs might not be attainable in 2020 but 15 is well within reach. On 58 occasions a player hit at least 15 homers in his team's first 60 games the last three years. It's not uncommon to see a player hit a ton of home runs early then cool off later in the season, so everything evens out. Since the season is so short, that cool down period may never come for some players.
There are far more home runs than stolen bases in today's game -- last season 6,776 homers were hit and only 2,280 bases were stolen (3,112 were attempted) -- but their benchmarks are the same. A 20-steal season is good the same way a 20-homer season is good. Similarly, a 30-steal season is great and a 50-steal season puts you at or near the top of the league.
The key difference is there are way fewer 20-steal players than there are 20-homer players. Only 21 players stole at least 20 bases last season and only eight -- eight! -- stole 30. Ronald Acuna Jr. flirted with a 40-40 season last year and was eyeing 50-50 this year before the shutdown. Can he go 20-20 in a 60-game season? In some respects it would be more impressive than 50-50.
Saves also have the same basic statistical benchmarks as homers (and steals). A 20-save season is pretty good and a 50-game season means you've really put in work. Last season Shane Greene saved each of the Tigers first 10 wins and 13 of their first 14 wins. I am hoping we see someone close out each of his team's wins in 2020. Bring on the weird.
Runs batted in
| 162-game total | 60-game equivalent |
|---|---|
120 RBI | 44 RBI |
110 RBI | 41 RBI |
100 RBI | 37 RBI |
90 RBI | 33 RBI |
80 RBI | 30 RBI |
These days we know RBI are not the best way to evaluate a hitter. They're as much a function of opportunity (i.e. how often did the player hit with men on base?) as they are player skill. Still, players crave them, and when they look up at the scoreboard late in the season, there's something satisfying about seeing "100 RBI" next to your name. RBI matter to players.
We've seen some torrid RBI paces over the years. Hall of Famer Jeff Bagwell drove in 116 runs in 110 games during the strike-shortened 1994 season. The last player to average over an RBI per game through 60 games was Miguel Cabrera, who drove in 67 runs in 60 games in 2013. Last season Nolan Arenado and Josh Bell each had 54 RBI through 60 games.
No, "11 and 37" doesn't have quite the same ring to it as "30 and 100," but they are equivalent during this short season. Sock 15 home runs and drive in 40 runs and you'll be an MVP candidate in 2020.
Hits
| 162-game total | 60-game equivalent |
|---|---|
225 hits | 83 hits |
200 hits | 74 hits |
175 hits | 65 hits |
150 hits | 56 hits |
The 200-hit season is a becoming a statistical rarity. Last season only two players (Rafael Devers and Whit Merrifield) reached the 200-hit plateau. No one did it in 2018 and on only 14 occasions did a player record 200-plus hits in a season from 2013-19. As recently as 2007 eight players had 200 hits. Hits are hard to come by nowadays. Pitchers are that nasty.
Four players recorded at least 80 hits in their team's first 60 games the last three years: Charlie Blackmon (81) in 2017, Jose Altuve (81) and Jean Segura (80) in 2018, and Arenado (82) in 2019. Only 22 players had at least 74 hits -- a 200-hit pace -- in their first 60 games from 2017-19. Given the risk of missed time, it is entirely possible the MLB leader will have fewer than 70 hits in 2020.
Innings pitched
| 162-game total | 60-game equivalent |
|---|---|
220 IP | 81 1/3 IP |
200 IP | 74 IP |
180 IP | 66 2/3 IP |
160 IP | 59 1/3 IP |
A five-man rotation in a 60-game season means each starter can be expected to make 12 starts. Some teams are already discussing a six-man rotation (Angels and Mariners), others are considering using someone every fourth day (the Reds and Trevor Bauer), and I'm sure teams will use off-days to skip their fifth starter when possible. Generally speaking, 12 starts is a reasonable expectation.
Seventy-four innings in 12 starts is a little more than six innings per start. The league average last year with close to 5 2/3 innings per start even after removing openers, so getting to 70 innings in 2020 will take some work. Only 35 pitchers threw at least 80 innings in their team's first 60 games the last three years, though three managed to throw as many as 90 innings.
This is not a normal season though. Teams will be cautious with their pitchers early on because everyone's throwing routine was messed up by the shutdown, and clubs would rather take it a little easy on their guys now than risk losing them for a long time later. Also, not many pitchers will be fully stretched out come Opening Day. That'll cut into innings totals.
New Yankees ace Gerrit Cole has already thrown as many as five innings and 67 pitches in an intrasquad game during Summer Camp. He could be good for 6-7 innings come Opening Day and, if the Yankees really push him hard, maybe he can get to 80 innings. Seeing how he's in Year 1 of a nine-year deal, I'd bet against it. Seventy innings will make you a workhorse in 2020.
Strikeouts
| 162-game total | 60-game equivalent |
|---|---|
300 K | 111 K |
250 K | 93 K |
200 K | 74 K |
150 K | 56 K |
The 200-hit season is fading away and the 300-strikeout season is making a comeback. There have been five 300-strikeout seasons since 2015, more than there were from 2000-14 combined, and last year Cole struck out 326 batters, the most by a right-handed pitcher since Nolan Ryan struck out 341 batters in 1977. Strikeouts are everywhere in today's MLB.
Incredibly, Max Scherzer struck out 133 batters -- 133! -- through 60 team games in 2018. He did that in 13 starts and 87 2/3 innings. Fourteen others reached 100 strikeouts in their team's first 60 games the last three years, and 17 others reached at least 90 strikeouts. We could see multiple pitchers finish on a 300-strikeout pace in 2020.
That said, workload limitations and healthy risks make it less likely to happen. Teams will be cautious with their top pitchers and getting pulled even one inning quicker than usual make it less likely a pitcher reaches triple-digit strikeouts in 2020. I think we'll see at least one 100-strikeout pitcher in 2020. Getting to 110 strikeouts is not out of the realm of possibility either.
The flip side of this is hitter strikeouts. Thirteen times in history a hitter has struck out 200-plus times in a season and all 13 have happened within the last 12 years. The most strikeouts through 60 team games in history is 96 by Adam Dunn in 2012. Chris Davis is the only other player to strike out 90-plus times through 60 team games (90 in 2009 and 94 in 2017).
Because each game carries increased importance during a shortened season, I would not expect to see a hitter stay in the lineup long if he starts out with a record strikeout pace. Unless he provides a ton of power, it's hard to see someone playing as much as required to finish the 60-game season with 90-plus strikeouts.
Pitcher wins
| 162-game total | 60-game equivalent |
|---|---|
24 wins | 9 wins |
22 wins | 8 wins |
20 wins | 7 wins |
18 wins | 7 wins |
16 wins | 6 wins |
Seven wins is the 60-game equivalent to both 18 wins and 20 wins because of rounding. An 18-win season is equivalent to 6.67 wins in a 60-game season and 20 wins is equivalent to 7.41 wins, so there you go.
Anyway, there are two ways to look at pitcher wins. The first way is simply prorating win totals like in the table above. Seven wins in a 60-game season is roughly equivalent to 20 wins in a 162-game season. The second way is looking at how many starts these guys will actually make. A five-man rotation in a 60-game season is 12 starts per pitcher, so an 11 or 12-win season is possible, and 12 wins in 60 games is equivalent to 32 wins in 162 games.
In the last three years only one pitcher (Scherzer) won 10 times in his team's first 60 games. He did it in 2018 (in 13 starts). Scherzer and Dallas Keuchel are the only pitchers to win at least nine of their first 12 starts since 2017. Keuchel went 9-0 in his first 12 starts in 2017 and Scherzer went 9-1 in his first 12 starts in 2018.
A 10-win season in 2020 is possible, sure, but it'll be real tough, especially if teams have quick hooks for health reasons early in the season and leave so many innings to the bullpen. More likely, we'll see the league leaders finish 2020 with eight or so wins.
Team wins
| 162-game total | 60-game equivalent |
|---|---|
105 wins | 39 wins |
100 wins | 37 wins |
95 wins | 35 wins |
90 wins | 33 wins |
85 wins | 31 wins |
80 wins | 30 wins |
Every game in 2020 is the equivalent to 2.7 games in a full 162-game season, so while 33-27 doesn't seem so special -- it's only six games over .500, after all -- it is a 90-win pace. The difference between a 90-win pace and a 100-win pace is four wins in a 60-game season. That's all. A few bounces or bullpen meltdowns can change everything.
Here are a few notable 60-game stretches from 2017-19:
- Best 60-game start: 42-18 by 2017 Astros
- Worst 60-game start: 19-41 by Orioles (2018 and 2019) and Royals (2019)
- Best 60-game stretch: 51-9 by 2017 Dodgers (June 9 to August 19)
- Worst 60-game stretch: 12-48 by 2019 Tigers (done multiple times)
Going 40-20 in 2020 is the equivalent of going 108-54 in a full 162-game season. It's doable. It would take an incredible run of good fortune and good health, but it is doable. I think it's much more likely a team loses 50 games than wins 40 though. A bad rebuilding team getting hammered by injuries and/or illness could undermine the sport's competitive integrity real quick.
In theory, the short season will give teams less time to create separation in the standings. That may be true, but three teams had at least a nine-game division lead after 60 games last season, so there's still enough time to get hot and pull away. As long as most division races and the wild card races are tight come late September, MLB will be happy.
Wins Above Replacement
| 162-game season | 60-game equivalent |
|---|---|
6.0 WAR | 2.2 WAR |
5.0 WAR | 1.9 WAR |
4.0 WAR | 1.5 WAR |
3.0 WAR | 1.1 WAR |
2.0 WAR | 0.7 WAR |
It's best to look at WAR in tiers because the data is not precise enough to pretend a few decimal points are statistically meaningful. A 2-WAR player is a league average player. A 4-WAR player is an All-Star caliber guy. A 6-WAR player is a true star and among the game's greats. Get up to 8-10 WAR territory and you're in Troutsville. There is no sense in sweating 2.9 WAR vs. 3.3 WAR or something like that. They're roughly equal.
During the short season WAR will be less accurate than usual because defensive stats need large sample sizes to become reliable, and 60 games is not a big sample in the world of defensive stats. This will affect both hitters and pitchers. Hitters will not be properly credited for their defensive contributions and pitchers won't be properly credited for their team's defense behind them. It matters. A team's defense factors into their pitcher's WAR (e.g. extra credit for pitching well if his defense is bad).
While WAR is a helpful catch-all number, this year it will be more important than ever to look at its components. How much credit is the hitter getting for his bat? His glove? His baserunning? The more WAR tied to defense, the less reliable it will be in 60 games. For pitchers, how is he doing suppressing walks and homers, and racking up strikeouts? The pitcher can control those things. He needs help from his defense on balls in play.
Every season a player(s) gets off to an incredible start and is on pace for something like 15 WAR through two months. It never lasts because the player cools down at the plate and/or his defensive numbers come back to Earth. This year though, there may not be enough time for that to happen. Who's to say we can't see someone finish with 5 WAR in 60 games?
I'm not sure how useful WAR will be in a 60-game season. I don't think we should dismiss it entirely either. We just have to make an effort to understand what it's telling us and how it breaks down. This isn't as simple as prorating home run or strikeout totals.
ERA and batting title qualifiers
| 162-game season | 60-game season | |
|---|---|---|
3.1 plate appearances per team game | 502 plate appearances | 186 plate appearances |
1 inning pitched per team game | 162 innings | 60 innings |
At some point soon MLB will need to have a conversation about lowering the innings total required to qualify for the ERA title. Last year only 61 pitchers qualified for the ERA title. Five years ago 78 pitchers qualified and 10 years ago 92 pitchers qualified. Pitcher usage is trending down and the league will have to adjust the qualifying total at some point, but I digress.
This season a mere 186 plate appearances will qualify a hitter for the batting title. Tim Anderson led baseball with a .335 batting average last year but lower the qualifying threshold to 186 plate appearances and someone else would've taken home the crown:
- Howie Kendrick: .344 (370 plate appearances)
- Tim Anderson: .335 (518 plate appearances)
- Luis Arraez: .334 (366 plate appearances)
- Donovan Solano: .330 (228 plate appearances)
- Several tied at .329
The highest batting average through 60 team games with at least 186 plate appearances the last three years is .376 by Bellinger last season. He had 249 plate appearances. Ryan Zimmerman hit .365 in 230 plate appearances through 60 team games in 2017. No other player has hit at least .350 through that many games and that many plate appearances since 2017.
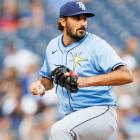
As for the ERA title, the odds are good we'll see multiple pitchers qualify with a sub-2.00 ERA in 2020. Nine pitchers threw at least 60 innings with a sub-2.00 ERA in their team's first 60 games the last three years, including Jake Odorizzi (1.41 ERA in 63 2/3 innings) and Hyun-Jin Ryu (2.48 ERA in 73 innings) last season. This year's Cy Young winner could finish with eight wins, 90 strikeouts, and an ERA that starts with a 1.