How to tell the difference between bad luck and under-performance amid MLB slumps
Early-season underperformance is sometimes just bad luck

By
Dayn Perry
•
6 min read

We're coming upon the one-third mark of the 2017 season, so it's still relatively early out there. As such, you're still seeing a lot of performances, particularly at the individual level, that might be driven by luck or the lack thereof. That is, it takes a while for some numbers to stabilize and have meaning, and in a lot of instances we're not to that point yet. Those #facts provide us with the opportunity to look at some early-season struggles/underperformances that might undergo a correction pretty soon.
So how do you go about teasing out those kinds of performances? Let's explore that very matter -- i.e., picking out players who might be in for better days ahead -- by looking at some telling numbers and applying them to specific player examples ...


Briefly, let's introduce (or reintroduce) a FanGraphs metric called weighted on-base average, or wOBA. It's scaled to look like on-base percentage, so a mark of .400 would be very good, while something like .250 would be unacceptably bad. wOBA measures every possible thing a hitter can do at the plate and it assigns time-tested, data-backed run values to those events and bakes them all into this one number. So it's a catch-all offensive statistic that provides a very telling and accurate snapshot of a hitter's value. By way of example, in 2016 David Ortiz led all qualifiers with a wOBA of .419, while Adeiny Hechavarria was last among that same group of qualifiers with a wOBA of .256.
Anyhow, Statcast and Baseball Savant have cooked up an expected wOBA (xwOBA) statistic that takes into account how hard a hitter strikes the ball and at what angle the ball leaves his bat. By accounting for those two very basic ingredients of hitting, you can come up with what a player's wOBA should be given the typical outcomes of his exit velocity and launch angle patterns. When you compare xwOBA to wOBA, you find who's underperforming or overperforming at this very fundamental level.
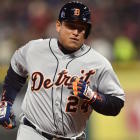
And that brings us to Cabrera. Thus far in 2017, no hitter has an xwOBA that outstrips his actual wOBA by such a margin. Cabrera has a wOBA of .360, but his xwOBA checks in at a robust .445. Right now, Cabrera has an OPS+ of 121, which is pretty good, but the hitting basics suggest he's going to improve upon that mark in the weeks to come and probably by a big margin.


When trying to determine whether a pitcher has been unlucky, a good place to start is by looking at his strand rate (LOB percentage), or the percentage of runners he prevents from scoring. The league LOB percentage is almost always around 72 percent, and pitchers who deviate far from that mark can usually expect to undergo a correction. (Sure, you can argue that some pitchers are much worse from the stretch, which accounts for their inability to strand runners, but such pitchers tend not to survive at the highest level for very long.)
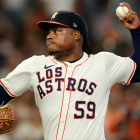
Colon? He's running a LOB percentage of 51.9, which is an absurdly low figure. To be sure, Colon is 44 and has shown signs of skills loss when it comes to command and control. I doubt he'll be good again, but there's reason to believe he's not this bad. If we look at Colon's fielding-independent pitching numbers (FIP) -- i.e., what his ERA should be based on strikeouts, walks and homers allowed -- there's more than a two-run gap between his ERA and his FIP. That's massive, the biggest in baseball right now. Assuming Colon sticks in the Atlanta rotation for long enough, he should improve, possibly all the way to back-of-the-rotation adequacy. Inspiring, no?


Another way to identify underperforming pitchers is to home in on batting average on balls in play, or BABIP. BABIP is simply the average a pitcher allows on fair-hit balls that don't leave the park. While pitchers certainly have some ability to control contact off the bat -- especially those who command cutters and changeups -- and defense is a factor, most pitchers will settle in with a BABIP between .290 and .300. When you see wide swings out of that range that are also out of step with the pitcher's established levels, then you likely have a short-lived fluke performance before you.
As for Porcello, not much has changed at a fundamental level from his 2016 Cy Young season through the present. His velocity and pitch mix haven't changed much from year to year, and this season he's striking out 22.2 percent of opposing batters versus a 21.2 percent mark in 2016. His LOB percentage also hasn't budged all that much. What has changed is Porcello's BABIP. He entered the 2017 season with a career BABIP of .308. This year, however, that figure is up to .367, which "leads" all qualifiers by a significant margin. In the absence of underlying injury and/or declining stuff -- there's no evidence that any of that is happening with Porcello -- that's probably not going to last. Just as Porcello benefited from a depressed BABIP in 2016, he's getting dinged by an elevated mark this year. While it's always possible for a pitcher or hitter to perform in an aberrant manner for a full season, the sensible approach is to look for a near-term correction. That's why you might expect better results from Porcello in the starts to come.


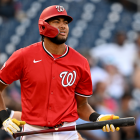
To be sure, the Alex Gordon who made three straight All-Star Games and got some down-ballot MVP support is probably gone forever. He's 33 and has struggled at the plate since pretty much the start of the 2016 season. Gordon still adds value in the field, but the question is whether he's going to improve upon his heretofore miserable 2017 performance with the bat.
He probably will, and that has to do with the lack of power he has shown. From Gordon's resurgent 2011 season through last year, he averaged 21 homers per 162 games played. In 2017, he has precisely zero home runs through 49 games and 168 at-bats. This no doubt has something to do with Gordon's declining fly-ball tendencies and lack of quality contact. Even within that profile, though, there's some hard luck. For his career, Gordon has homered on 10.5 percent of his fly balls, and that figure includes his 2017 season, in which he has of course homered on 0.0 percent of his fly balls. Isolate Gordon's peak and even his sub-par 2016, and his HR/FB rate is even higher.
We typically think of HR/FB rate as being unsustainable on the other end of the continuum. For instance, Aaron Judge, great as he is, probably isn't going to continue homering on almost 40 percent of his fly balls. It can also be indicative of bad luck on the other side of things. Again, Gordon isn't likely to return to peak form, but eventually a few of those fly balls are going to go over the fence, even if overall decline has taken hold. No coincidence, then, that Gordon isn't too far behind Cabrera on the xwOBA-wOBA rankings noted above. In other words, better days are likely ahead for Gordon, even if good days aren't.
Let's "bottom line" it, shall we?
- An easy way identify hitters who might be in for a positive correction is to check out the top of the "xwOBA minus wOBA" leaderboards over at Baseball Savant.
- As for pitchers, eyeball those whose strand rate is well below the usual 72 percent mark. Also, check BABIP figures and see who's well above the .290-.300 range that is the norm. You can complete these essential tasks and duties at Baseball-Reference or FanGraphs.
- If you want to undertake a bit of a deeper dive on the pitching front, then head over to Brooks Baseball and see if the hurler in question is showing typical velocity and/or has changed his repertoire.
As you were, people of baseball.