Math says: 2014 Florida State was the luckiest team of past 17 years
According to the concept of Pythagorean wins and one writer's calculations, last season Florida State outperformed its expected record by a wider margin than any team since at least 1998.

By
Jerry Hinnen
•
4 min read
"Luck" is -- to put it mildly -- a loaded term when it comes to college football. Tell an Auburn fan the 2013 Prayer in Jordan-Hare to beat Georgia was luck, and he or she may sheepishly agree with you. Tell him or her Auburn's run to that season's BCS championship game was luck, and you're about to have a loud, unpleasant argument on your hands.
But where the numbers-crunchers and stat geeks of the sport are concerned (as well as those of baseball, basketball, etc.) "luck" means something fairly specific: something fortuitous happening that is statistically unlikely to happen again. And where a team's win-loss record is concerned, luck can be measured using the concept of Pythagorean wins. The numbers are complicated, but the idea is not: Take all the points a team scores and all the points it allows for a season, use them to calculate what you would expect a team's record to be, and compare to what the team's record actually was. If that team finished with more wins than its point totals suggested was likely, then it got -- statistically speaking -- lucky.
Using the same Pythagorean formula first applied to the NFL by Football Outsiders, blogger David Wunderlich of SEC blog Team Speed Kills has calculated luck for college football teams for years; his numbers for 2014, published this week, showed that Missouri won nearly two more games than their Pythagorean expectation, making them the luckiest team in the SEC last season.
| Luckiest teams of 2014 | |||
| Team | Pythagorean Wins | Actual Wins | Luck |
| Florida State | 9.21 | 13 | 3.79 |
| Rutgers | 5.57 | 8 | 2.43 |
| Northern Illinois | 8.67 | 11 | 2.43 |
| UCLA | 7.83 | 10 | 2.17 |
| Boise State | 10.05 | 12 | 1.95 |
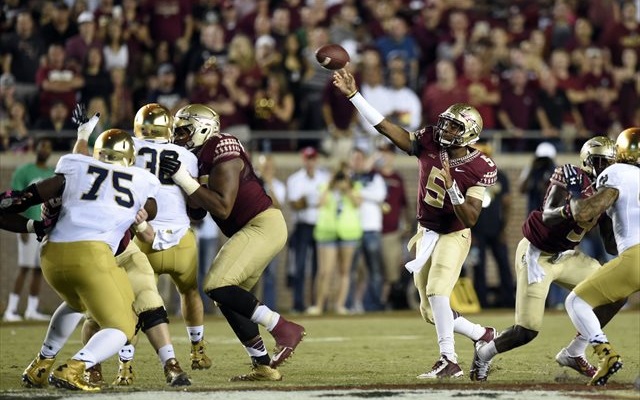
But it was an additional, non-SEC note from Wunderlich that really caught the eye: not only was 2014 Florida State the luckiest team in the FBS by this metric, it was the luckiest of the past 17 seasons -- as far back as Wunderlich's numbers go. The Seminoles outscored their opponents by only 114 points across their 14 games, yielding an expected winning percentage of .66 and 9.21 expected wins. Jimbo Fisher and Co. actually won 13 games, of course, bettering their Pythagorean record by 3.79 wins, more than a full win luckier than 2014 runner-up Rutgers and the largest number since Wunderlich's database begins in 1998*.
So what does it mean to say that 2014 Florida State was the luckiest team in 17 years? Contrary to what Seminole fans are probably thinking it means as they read this, what it doesn't mean is that FSU accomplished anything less than what it accomplished last fall; wins are wins are wins, and ACC title are ACC titles are ACC titles, and the Seminoles have the trophy to prove it. What it means is that winning 13 games while only scoring and allowing as many points as the Seminoles did is an extreme statistical fluke that's unlikely to repeat itself -- that, in short, FSU wasn't as good a football team as its record. That doesn't change its record, of course, but when we're projecting how good a football team the Seminoles will be this upcoming season, it does suggest it will be more helpful to think of 2014 FSU as a 9-5 team than a 13-1 one.
| Luckiest teams since 1998 | |||
| Team | Luck | ||
| 2014 Florida State | 3.79 | ||
| 2010 Miami (OH) | 3.61 | ||
| 2009 Wyoming | 3.37 | ||
| 2010 Auburn | 3.06 | ||
| 2005 UCLA | 3.05 | ||
If you're skeptical, look at the other teams to enter the rarified air of exceeding their Pythagorean record by three or more wins. 2010 Miami (Ohio) finished at +3.61, the second-largest number in Wunderlich's database, after going 10-4; the 2011 Redhawks slipped to 4-8. After going 7-6 in 2009, Wyoming went 3-9 the following year. 2010 BCS champion Auburn went from 14 wins to eight in 2011, a season in which they were smashed by LSU, Georgia and Alabama by an average of 34 points. And after winning 10 games in Karl Dorrell's "breakthrough" 2005 campaign, UCLA went right back to winning seven in 2006. (This works the other way, too; the unluckiest team of the past 17 years according to Wunderlich, 2011 UCF at -3.59, went from 5-7 to 10-4 in 2012.)
What does "2014 Florida State was the luckiest team in 17 years" mean? It means that while nothing's guaranteed**, expecting a substantial dip in the first year of the post-Jameis Winston era is probably the right move. And if you don't agree, Tallahassee faithful, you can take it up with the math.
*Because the NCAA didn't begin counting bowl statistics until 2002, bowl games aren't included in calculations from 1998 through 2001.
**In 2012, Ohio State posted the fourth-highest wins-over-expectation mark of the past five years (+2.88) in going 12-0, then promptly went 12-0 again the following regular season ... albeit before losing the Big Ten Championship Game and the Orange Bowl to close the season.
***Just one other note: Football Study Hall's Bill Connelly recently calculated "second-order wins" -- a metric that might be considered a more advanced, statistically complicated version of Pythagorean wins -- and found last year's Florida State team to be the second-biggest "overachiever" in terms of expected record since 2005. So the Pythagoeran calculations have some company.