The numbers that will tell the story of 2016: National League West
The Diamondbacks' rotation ERA, Joc Pederson's batting average and more will help shape the NL West in 2016.

By
Matt Snyder
•
7 min read

A team's success or lack thereof is never reducible to any one player, or even one segment of the roster. You watch baseball, and you know this. Somewhere on each team, though, is one or more "bellwether" performers upon whom, it may be plausibly stated, the season in question may well hinge. This is baseball, of course, a structurally balanced sport, so it's never any one player or role or even segment of the roster. Sometimes, though, success or failure at the team level can in part cascade from the performance of a less obvious contributor. Or sometimes it's, yes, someone on the scale of a Mike Trout or a Bryce Harper or a Miguel Cabrera.
That's the sort of thing we're talking about right now. We've been going division-by-division, and boiling down each team's essence to the outputs of a player or small group of players. We'll distill it even further down to one number that the player or players in question need to reach in order for the team in question to make the most of their lot in 2016. What follows, then, are the numbers that will tell the story of the 2016 season for each team.
To round out our series, it's the National League West ...
Previous: AL East | NL East | AL Central | NL Central | AL West

Arizona Diamondbacks
The number: Rotation ERA
The Diamondbacks were second in the NL in runs scored last season and rated out as one of the two best in most advanced defensive metrics. So why did they only finish 79-83? Well, that's an easy answer and we all know that. The pitching was bad, particularly the rotation in May (4.99 ERA) and June (4.92). On the whole, their starters posted a 4.37 ERA, good for 11th in the NL.
There will probably be some places the offense regresses this season, though not greatly. So the key is for the pitching to make strides forward with the additions of Zack Greinke and Shelby Miller on top of a full season of health from Patrick Corbin. Maybe talented youngster Archie Bradley makes an impact down the line, too.
The five NL playoff teams last season were literally the top five in rotation ERA (in order: Cardinals, Dodgers, Cubs, Mets, Pirates). To get into the top five this year, the Diamondbacks would likely need a rotation ERA in the ballpark of 3.50. They might not need to be top five in order to make the playoffs, but they better be close.

Colorado Rockies
The number: Road slash line
This is almost mind-boggling. Last year's home/road splits for the Rockies:
(batting average/on-base percentage/slugging percentage)
Home: .302/.352/.489
Road: .228/.277/.375
On the road, the Rockies ranked dead last in average and OBP while ranking 29th in slugging (poor Braves). At home, they led the majors in all three categories.
We love to talk about the offensive advantage and pitching disadvantage provided by Coors Field, but this kind of a gap in home/road performance with the bats has been a problem for a while.
Is this a competitive disadvantage from playing most of the time in thin air? It seems reasonable. If that's the case, this roster isn't talented enough to overcome that for its 81 road games. So watch that road slash line. If the Rockies overachieve this season, it will likely be due to figuring out how to better hit on the road.

Los Angeles Dodgers
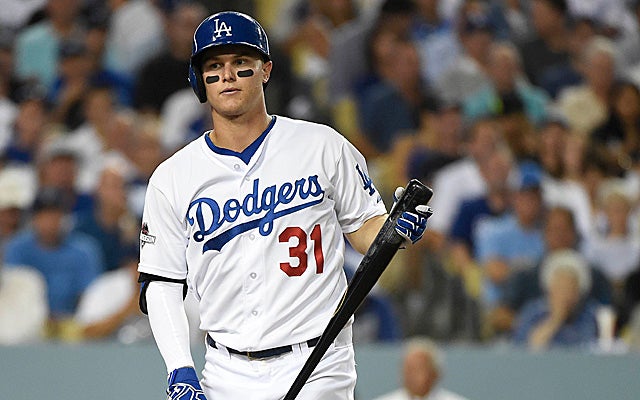
The number: Joc Pederson's batting average
I've gone to great lengths in recent years to discount batting average as a primary stat, but there's a good reason I have this here. Pederson's power and ability to get on base via the walk are going to be there. That's well-established. The fact that Pederson hit .210 last season is less important than several other things, but if those other things come together and he hits .250, he's a star.
Given Pederson's walk rate, hitting .250 pushes him up over a .375 OBP with ease (it was .346 last year despite the .210 average). This is exceptional. Only 11 qualified hitters in baseball had and OBP higher than .375 last year and they were Bryce Harper, Joey Votto, Miguel Cabrera, Paul Goldschmidt, Mike Trout, Andrew McCutchen, Anthony Rizzo, Michael Brantley, Buster Posey, Prince Fielder and Jose Bautista.
With Pederson's power and defensive prowess, this would make him an elite all-around player.
Can he hit .250, though? It's a question of making hard contact. He's always had issues with contact, as his strikeout percentage of 29.1 was the fifth-highest in baseball last season among qualifiers. Someone who uses batting average on balls in play as a lazy crutch in judging average might point to Pederson's second half .232 BABIP and say he was just unlucky, but there's more to it than that. He wasn't hitting the ball as hard, specifically due to not squaring it up. His line drive percentage dipped 3.5 percent, but the big move was pop ups. His infield fly percentage was 10.1 in the first half and a whopping 22.6 in the second half. That'll crush your BABIP, so it wasn't bad luck so much as bad performance. It also did a number on his power, suppressing him to a .300 slugging percentage in the second half.
Pederson has the tools to start squaring the ball up again. He's talented enough to cut down some on the strikeouts. If he does those things and his average rises to around .250, he'll be a huge boost to this ballclub.

San Diego Padres
The number: Number of starts from Tyson Ross
Ross will be a free agent after the 2017 season, so if the Padres are out of the race come July -- a pretty good bet -- it's possible Ross will become the most coveted starting pitcher on the trading block. Instead of a rental (such as Johnny Cueto was for the champion Royals last season), Ross would provide any acquiring team with roughly a season and a half of service, so the Padres can likely get a nice prospect haul in return.
Of course, what if the Padres do contend? Then they obviously have to keep Ross. So if Ross makes 30-plus starts, I think we'll be able to say that the season was successful in terms of wins and losses overall -- or at least it was through the trade deadline. If he only makes around 17, then he was either injured or has been dealt. If either of those things comes true, we can pretty firmly bet on a poor Padres season.

San Francisco Giants
The number: ERA, Johnny Cueto and Jeff Samardzija combined
The Giants get to play half their games in one of baseball's most pitcher-friendly ballparks, the gorgeous AT&T Park. They also have one of the game's best starting pitchers in Madison Bumgarner. And yet, they were only seventh in the NL in rotation ERA last season at a 3.95 clip. So despite having ranked first in batting average and on-base percentage in the NL, they were only 84-78 and missed the playoffs.
Enter free agent signees Johnny Cueto and Jeff Samardzija. Both come with questions and immense upside.
Cueto had a 4.76 ERA in 13 starts with the Royals and was a mixed bag in the postseason. Of course, in 2014 he was 20-9 with a 2.25 ERA while leading the NL in strikeouts and innings pitched. He's only going to be 30 this season, so he's fully capable of becoming an ace again.
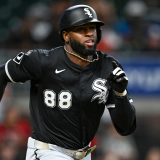
Samardzija led the AL in hits, earned runs and home runs allowed in a disaster of a season for the White Sox last year. He had a 4.96 ERA while his strikeout rate went from 8.3 (K/9) to 6.9. In 2014, though, he had a 2.99 ERA and 1.07 WHIP with 202 strikeouts in 219 2/3 innings.
Let's say Cueto posts a 2.50 ERA and Samardzija is around 3.00. The best guess there is the Giants are in the playoffs and then it's time for the Even Year Madness to take over.
Coming Monday: We start our team previews with one team per day!