Home attendance at all major college football games declined for the sixth consecutive year, though once again at a smaller rate compared to some past seasons.
Football Bowl Subdivision crowds averaged 43,106 fans per game in 2016,downby less than 1 percent from 2015, according to a CBS Sports analysis of NCAA attendance data. The 2015 crowds also declined by less than 1 percent after a 4-percent drop in 2014.
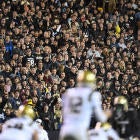
This year's average crowd was again the lowest since 2000 (42,631). Crowd sizes were down 7 percent since peaking in 2008 (46,565). Universities have tried with mixed results to keep fans in stadiums instead of watching for less money from the comfort of their home.
As always, the data for this year's analysis counts only home games and not neutral-site venues. Figures represent the announced crowd totals schools reported to the NCAA and not necessarily actual attendance. Many athletic departments count attendance differently.
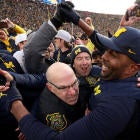
Michigan led the FBS again with 110,468 fans per game. At the bottom was Ball State (7,789 per game), whose total attendance of 38,946 was lower than what 58 FBS teams averaged over the course of the season.
Seventy-six percent of the top 25 attendance leaders experienced increases or remained the same. In 2015, only 44 percent of the top 25 could say that.
Despite another down year by Texas that resulted in Charlie Strong getting fired, Longhorns crowds averaged 97,881 fans, up 9 percent for their best season since 2013. Their crowds got boosted by a much-anticipated Week 1 game vs. Notre Dame, which obviously came before the Irish lost so many games.
LSU fired Les Miles early in the season, but its crowds were up 8 percent from last year. That's largely because LSU had a smaller-than-usual 2015 SEC game at home that got moved from South Carolina, and the Tigers played a 2016 SEC game at home moved from Florida with a large crowd.
One big attendance loser was Missouri, whose crowds dropped 20 percent one year after racial protests on campus that included a boycott by the football team. Once a perennial top-25 attendance leader, the Tigers averaged only 52,236 fans for its smallest crowds since 1996. Missouri expanded its stadium to 71,168 shortly after joining the SEC.
No. 9 USC's crowds (68,459) were its smallest since 2002 (66,852). Ten years ago, the Trojans averaged 91,480 under Pete Carroll. USC started slow on the field this season, including a 52-6 loss to Alabama, before finishing strong to earn a Rose Bowl trip. Still, USC didn't win a conference title for the eighth straight year, its longest drought since 1916-26.
The biggest decreases in the Power Five: Missouri (20 percent), Minnesota (16 percent), Kentucky (12 percent), Stanford (12 percent), Maryland (11 percent), USC (9 percent) and Arizona State (9 percent).
One of the big attendance winners was Miami, which saw its crowds increase by 23 percent under new coach Mark Richt. The Hurricanes' average of 58,572 was their best since 2004 (59,134) after spending many years over the past decade below 45,000.
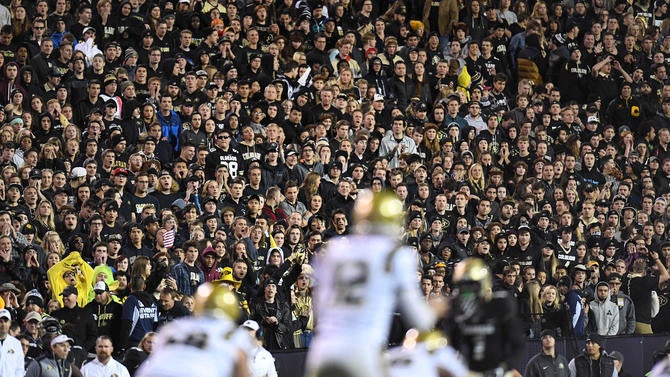
Colorado's surprising run to the Pac-12 Championship Game drew 46,609 fans per game for its best crowds since 2011. The Buffaloes were up 18 percent from 2015.
The biggest increases among Power Five schools: Miami (23 percent), Colorado (18 percent), Duke (13 percent), Iowa (10 percent), Louisville (10 percent), Illinois (10 percent) and Texas (9 percent).
Conference breakdown
SEC: The SEC struggled on the field by its standards. In the stands, the SEC remained the national leader in attendance (77,565 fans per game, down 1 percent from a record-breaking 2015 season). Tennessee surpassed 100,000 fans on average for the second straight year after not doing so from 2009-14. Texas A&M's crowds dipped 2 percent this season.
Big Ten: In the first year with nine Big Ten games, the league averaged 66,162 fans (up less than 1 percent from 2015). The return to prominence of Michigan and Penn State helped offset smaller crowds at Maryland and Rutgers since they joined the league in 2014. Penn State was drawing roughly 4,000 fewer fans per game a couple years ago.
Big 12: Despite missing the College Football Playoff again, the Big 12 increased crowds by 1 percent to 57,238, ending three straight years of declining attendance. Texas, Oklahoma, Texas Tech and West Virginia were up. Baylor was down only 1 percent after Art Briles' firing. Eighteen Group of Five teams drew more fans than Kansas (25,828), which finished last among Power Five schools.
Pac-12: Pac-12 crowds declined 3 percent to 50,112 and were down 14 percent since 2007. Washington was up 4 percent during its run to the playoff. The Pac-12's attendance leader (USC) ranked 22nd nationally and trailed nine SEC teams and seven Big Ten teams. Stanford and Oregon were also down. College football remains a tough sell on the West Coast.
ACC: At 49,827 fans per game, the basketball-centric ACC remained last among the Power Five. But the ACC was up 3 percent from last year. Louisville, Florida State, Miami and Duke enjoyed spikes. Virginia Tech, which had fewer fans than Kentucky in 2015, was back near the top 25. Clemson (80,970) remained the ACC attendance leader and in the top 15.
AAC: The AAC, which averaged 31,611 (nearly the same as 2015), is clearly No. 1 for Group of Five crowds. Tom Herman's "H-Town Takeover" increased Houston crowds by 35 percent over two years. South Florida was up 41 percent in 2016 with a 10-2 record and a home game vs. Florida State. Temple fell 38 percent without facing Notre Dame. Other than BYU, East Carolina (44,113) had the largest crowds outside the Power Five.
Mountain West: The Mountain West averaged 24,142 per game, comfortably behind the AAC. Conference leader San Diego State was up 28 percent. Wyoming increased 18 percent. Nevada, which fired coach Brian Polian, was down 17 percent.
Conference USA: At 19,849 fans per game, C-USA is clearly in the Sun Belt/MAC ballpark for fan interest as opposed to the AAC and Mountain West. Southern Miss (28,588) led C-USA. Florida Atlantic, which fired coach Charlie Partridge, was down 43 percent to 10,073.
Sun Belt: The Sun Belt averaged 17,993 fans per game. Appalachian State, which had a home game against Miami, led the conference at 26,153 and topped Kansas' average. Appalachian State was up 22 percent.
MAC: Even with Western Michigan rowing the boat to an undefeated season and a Cotton Bowl bid, the MAC finished last at 16,062 fans per game. Western Michigan averaged 23,838, up 23 percent. In 2012, Northern Illinois averaged 20,877 while reaching a BCS bowl. This year, Northern Illinois fell to 11,019 (123rd out of 128 FBS teams).
College football attendance in 2016
| School | 2016 Average | Change from 2015 | Stadium Capacity Filled (2016) |
| Michigan | 110,468 | Less than +1% | 103% |
| Ohio State | 107,278 | Less than +1% | 105% |
| Texas A&M | 101,917 | -2% | 99% |
| Alabama | 101,821 | +1% | 100% |
| LSU | 101,231 | +8% | 99% |
| Tennessee | 100,968 | Less than +1% | 99% |
| Penn State | 100,257 | Less than +1% | 94% |
| Texas | 97,881 | +9% | 98% |
| Georgia | 92,746 | 0% | 100% |
| Nebraska | 90,200 | Less than +1% | 104% |
| Florida | 87,846 | -2% | 99% |
| Auburn | 86,937 | -1% | 99% |
| Oklahoma | 86,857 | +2% | 106% |
| Clemson | 80,970 | -1% | 99% |
| Notre Dame | 80,795 | 0% | 100% |
| Wisconsin | 79,357 | +2% | 99% |
| South Carolina | 76,920 | -2% | 96% |
| Florida State | 76,800 | +5% | 93% |
| Michigan State | 74,667 | Less than +1% | 100% |
| Iowa | 69,656 | +10% | 99% |
| Arkansas | 69,581 | +3% | 97% |
| USC | 68,459 | -9% | 73% |
| UCLA | 67,459 | +1% | 74% |
| Ole Miss | 64,910 | +7% | 101% |
| Washington | 64,589 | +4% | 92% |
| Virginia Tech | 63,043 | +4% | 96% |
| Miami | 58,572 | +23% | 90% |
| BYU | 58,569 | Less than +1% | 91% |
| Mississippi State | 58,317 | -6% | 95% |
| Texas Tech | 58,250 | +3% | 96% |
| West Virginia | 57,583 | +5% | 96% |
| NC State | 57,497 | +1% | 100% |
| Oregon | 54,677 | -5% | 101% |
| Louisville | 54,065 | +10% | 98% |
| Oklahoma State | 53,814 | -7% | 89% |
| Kentucky | 53,643 | -12% | 88% |
| Iowa State | 52,557 | -7% | 86% |
| Missouri | 52,236 | -20% | 73% |
| Kansas State | 51,919 | -2% | 104% |
| North Carolina | 50,250 | +1% | 80% |
| Arizona | 48,288 | -6% | 87% |
| Arizona State | 47,736 | -9% | 74% |
| Georgia Tech | 47,503 | -6% | 86% |
| California | 46,628 | -4% | 75% |
| Colorado | 46,609 | +18% | 93% |
| Utah | 46,506 | Less than -1% | 102% |
| Pittsburgh | 46,076 | -4% | 70% |
| Baylor | 45,838 | -1% | 102% |
| Illinois | 45,644 | +10% | 75% |
| TCU | 45,168 | -3% | 100% |
| Rutgers | 44,804 | -6% | 85% |
| Stanford | 44,142 | -12% | 88% |
| East Carolina | 44,113 | +2% | 88% |
| Minnesota | 43,814 | -16% | 83% |
| Indiana | 43,027 | -3% | 82% |
| Virginia | 39,929 | -8% | 65% |
| Maryland | 39,615 | -11% | 76% |
| Houston | 38,953 | +15% | 97% |
| Oregon State | 37,622 | +4% | 83% |
| South Florida | 37,539 | +41% | 57% |
| Memphis | 37,346 | -15% | 66% |
| San Diego State | 37,289 | +28% | 73% |
| UCF | 35,802 | +16% | 81% |
| Northwestern | 34,798 | +4% | 74% |
| Purdue | 34,451 | -8% | 60% |
| Boise State | 34,273 | +3% | 94% |
| Cincinnati | 33,585 | -9% | 96% |
| Syracuse | 32,805 | +2% | 67% |
| Army | 32,653 | +5% | 86% |
| Boston College | 32,157 | +6% | 72% |
| Washington State | 31,675 | +8% | 97% |
| Navy | 31,571 | Less than -1% | 93% |
| Vanderbilt | 31,242 | -3% | 77% |
| Duke | 29,895 | +13% | 75% |
| Air Force | 29,587 | +14% | 63% |
| Southern Miss | 28,588 | +1% | 79% |
| Colorado State | 27,600 | +11% | 85% |
| Temple | 27,225 | -38% | 40% |
| Connecticut | 26,796 | -5% | 67% |
| Wake Forest | 26,456 | -1% | 84% |
| Appalachian State | 26,153 | +22% | 113% |
| Kansas | 25,828 | -5% | 51% |
| Fresno State | 25,493 | -12% | 62% |
| Marshall | 24,760 | -6% | 65% |
| Hawaii | 24,521 | +5% | 49% |
| Western Michigan | 23,838 | +23% | 79% |
| SMU | 23,712 | +13% | 74% |
| Texas-San Antonio | 23,038 | Less than +1% | 63% |
| Texas-El Paso | 23,001 | -1% | 44% |
| Tulane | 22,718 | -1% | 76% |
| Arkansas State | 22,700 | -1% | 74% |
| Troy | 22,534 | +14% | 75% |
| Rice | 21,425 | +11% | 46% |
| Wyoming | 21,266 | +18% | 73% |
| Ohio | 21,190 | -1% | 88% |
| Georgia Southern | 20,819 | Less than +1% | 83% |
| Toledo | 20,628 | -1% | 79% |
| Louisiana Tech | 20,412 | -3% | 73% |
| Louisiana-Lafayette | 20,224 | -6% | 65% |
| Old Dominion | 20,118 | 0% | 100% |
| North Texas | 19,878 | +46% | 64% |
| Tulsa | 19,234 | -2% | 64% |
| Utah State | 19,136 | -10% | 79% |
| New Mexico | 18,708 | -17% | 48% |
| Nevada | 18,501 | -17% | 62% |
| UNLV | 18,389 | -5% | 50% |
| Texas State | 18,120 | Less than -1% | 60% |
| Western Kentucky | 17,705 | -1% | 80% |
| Eastern Michigan | 17,677 | +261% | 59% |
| Buffalo | 17,493 | -5% | 60% |
| Central Michigan | 17,408 | +11% | 58% |
| Middle Tennessee | 17,243 | Less than +1% | 56% |
| Miami (Ohio) | 17,110 | +9% | 70% |
| Florida International | 16,789 | +9% | 84% |
| South Alabama | 16,250 | +1% | 49% |
| San Jose State | 15,419 | +1% | 51% |
| Bowling Green | 15,140 | -23% | 63% |
| Georgia State | 15,103 | +46% | 54% |
| Massachusetts | 14,510 | +30% | 85% |
| Charlotte | 14,192 | -3% | 93% |
| Louisiana-Monroe | 12,610 | +7% | 41% |
| Idaho | 11,190 | -4% | 70% |
| Northern Illinois | 11,019 | -21% | 47% |
| Kent State | 10,898 | -13% | 44% |
| Akron | 10,337 | -43% | 34% |
| Florida Atlantic | 10,073 | -43% | 34% |
| New Mexico State | 9,545 | -45% | 31% |
| Ball State | 7,789 | -2% | 35% |
| Note: The percentage of stadiums filled can exceed the capacity size when schools report selling additional tickets. In some cases, capacity sizes are estimates. | |||